


新着記事をお届け!


JAPAN’s Economic Outlook for Fiscal Years 2022 and 2023 (August 2022) | ニッセイ基礎研究所


- シンクタンクならニッセイ基礎研究所 >
- 経済 >
- 経済予測・経済見通し >
- JAPAN’s Economic Outlook for Fiscal Years 2022 and 2023 (August 2022)
JAPAN’s Economic Outlook for Fiscal Years 2022 and 2023 (August 2022)

経済研究部 経済調査部長 斎藤 太郎
このレポートの関連カテゴリ
文字サイズ
- 小
- 中
- 大
1. April–June 2022 grew at an annual rate of 2.2% quarter-on-quarter
In the April–June quarter of 2022, real GDP finally recovered to its pre-COVID-19 levels, 0.2% higher than the October–December quarter of 2019. By demand category, private consumption exceeded that in the pre-COVID-19 period by 1.3%, while government consumption far exceeded that in the pre-COVID-19 period, reflecting the cost of the health-care response and vaccination efforts. Meanwhile, housing investment, capital expenditure, and public investment remain below pre-COVID-19 levels. Exports are 2.3% higher, but the export of services remains well below the pre-COVID-19 levels; goods exports continue to rise on the back of a recovery in overseas economies and a weak yen, while inbound demand remains severely depressed.
In the October–December of 2019 quarter, Japan experienced a sharp contraction of 11.3% on an annualized basis due to the impact of a hike in the consumption tax rate and a significant drop in the level of economic activity ahead of the impact of COVID-19 becoming apparent. Compared to the most recent peak in the April–June quarter of 2019, real GDP is down 2.7%, and private consumption is down 1.8% in the April–June quarter of 2022. It appears that there is a long way to go before the economy normalizes.
After a sharp slowdown in 2020 due to the impact of COVID-19, the global economy recorded high growth in 2021, partly in reaction. Nevertheless, a clear deceleration trend has become apparent recently.
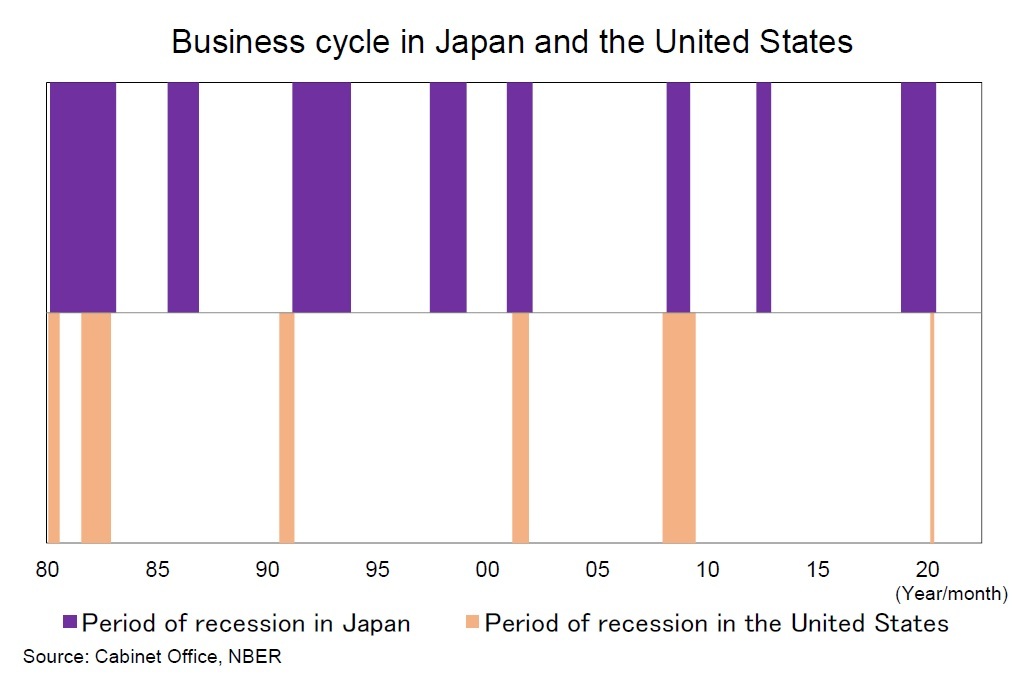
Real GDP in the United States, which recovered quickly from the COVID-19 crisis, contracted sequentially in the April–June quarter following the January–March quarter of 2022. This marked the second consecutive quarter of negative growth; a pattern generally considered a technical recession. The National Bureau of Economic Research is tasked with determining the formal business cycle. However, the economic indicators it considers important, such as employment and consumer spending, have generally remained strong and, while the definition of a technical recession has been met, this does not necessarily imply an actual recession.
 The current scenario is that a recession will be avoided in the United States but the impact of monetary tightening will keep growth below potential for the foreseeable future. The Federal Reserve has signaled that it will continue to tighten monetary policy to curb inflation even if it leads to a recession, raising the bar for a soft landing.
Looking at the business-cycle relationship between Japan and the United States since 1970, there have been cases where Japan was the only one of the two to fall into recession; for example, in the mid-1980s, when the yen was strong, and when the consumption tax rate was raised in 1997. However, whenever the United States has entered a recession, Japan has also been in a recession. Whether the United States avoids a recession now will likely have a major impact on the future of the Japanese economy.
The euro area economy is expected to fall into recession in late 2022 and early 2023 due to monetary tightening to curb inflation and the significant negative impact of the cuts in the supply of Russian gas on economic activity. Moreover, the outlook for China’s economy, which, as a result of the country’s lockdown, had a year-on-year growth rate close to 0% in the April–June quarter of 2022, is likely to remain at high risk of a downturn as a result of the government’s zero-COVID-19 policy.
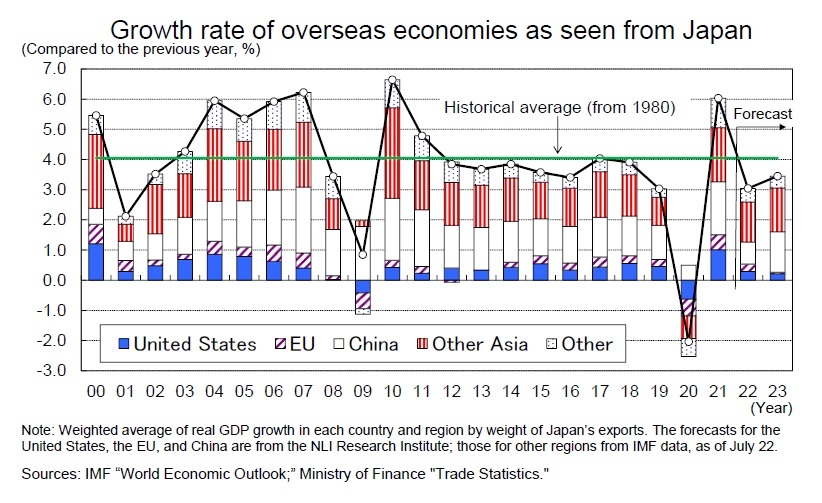 The growth rate of overseas economies weighted by Japan’s exports is expected to slow significantly to around 3% in 2022, after declining by around 2% in 2020 due to the impact of COVID-19 and rising by around 6% in 2021 as a reaction. The expected slowdown is due to a sharp decline in the growth rate of China’s real GDP from 8.1% in 2021 to its current 3% level, as well as an expected slowdown in the United States from 5.7% in 2021 to 1.6%, and a decrease in the euro area from 5.3% in 2021 to 2.7%. In 2023, with China’s real GDP returning to growth in the 6% range, but the US and the euro area expected to slow further to 1.2% and 0.5%, respectively, overseas economic growth in the eyes of Japan will remain in the mid- 3% range, still below the 4% average growth rate since 1980.
Exports fell sharply in FY 2020, down 10.0% from the previous year, but rebounded strongly in FY 2021, up 12.5%. Despite a boost from the weaker yen, FY 2022’s year-on-year growth is expected to slow significantly to 1.5% due to a slowdown in overseas economies, while FY 2023’s growth is expected to remain low at 1.8%.
Year-on-year consumer prices (total CPI excluding fresh foods, hereafter core CPI) have been in the low 2% range since April 2022, but the “total excluding imputed rent for owner-occupied housing” that households are actually facing is higher, at about 3%. High growth in fresh-food prices is not included in the core CPI, and low growth in imputed rent for owner-occupied homes (zero percent) is included but does not actually contribute to the gap between total and core CPI. We now expect FY 2022’s year-on-year core CPI to be 2.4% and total excluding imputed rent, to be 3.0%.
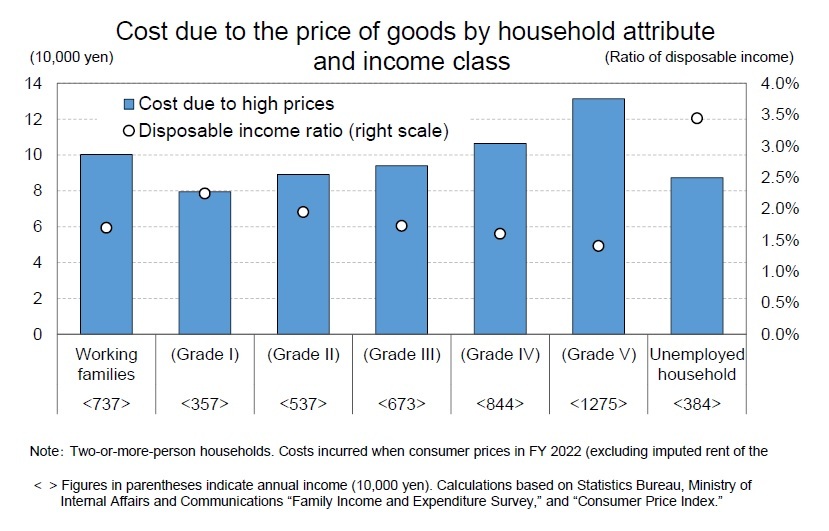 The burden of high prices varies according to household attributes. Based on FY 2022’s price projections, the estimated cost per household of high prices is 100,000 yen for working families and 87,000 yen for unemployed families (two-or-more-person households). When working families are categorized by income bracket, the burden is higher for those with higher incomes (because they spend more) than for those with lower annual incomes. In terms of the real effect, however, the burden of high prices, measured as a percentage of disposable income, is heavier for unemployed and working families with lower annual incomes than for working families. Behind this is the fact that the weight of “food” and “utilities,” both of which have relatively high inflation rates, is higher for unemployed households and those with a low annual income.
In FY 2022, the increased burden of high prices will weigh on consumer spending. However, households are still accumulating excessive savings due to the repeated restrictions on behavior imposed because of the COVID-19 crisis. If we calculate as excess savings the portion of the increase in savings in 2020 and 2021 (compared with that in 2019) caused by an increase in the savings rate, then the excess savings of working families would be 393,000 yen in 2020 and 301,000 yen in 2021, for a total of 694,000 yen.
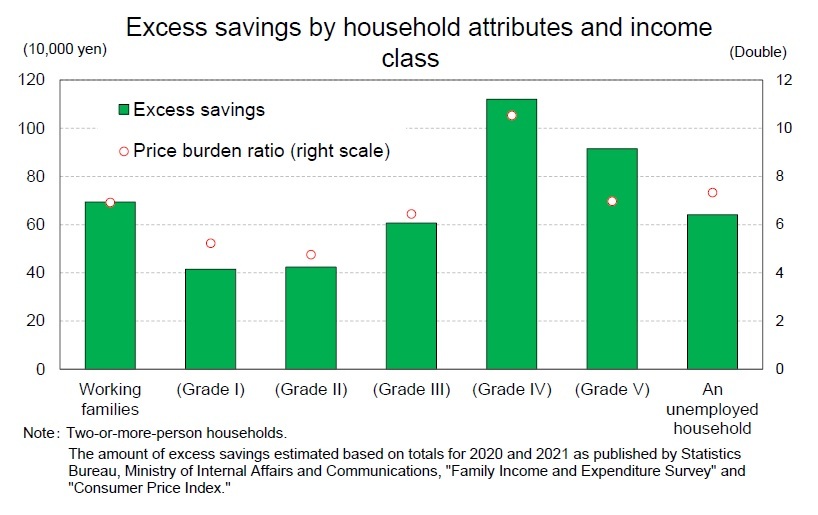 However, as with the burden of high prices, there may be differences in excess savings resulting from household attributes. When we estimate the excess savings by household attribute, jobless households, on average, account for 641,000 yen, slightly less than the working-age household. Among working families, there is a large excess of savings among those with a high annual income, exceeding 1 million yen among those in class IV. The ratio of excess savings to the burden of higher prices varies from 5.2 times for working families and those in class II to 10.5 times for those in class IV, but in all cases, the excess savings exceed the assumed burden of higher prices in FY 2022. This indicates that it is possible to mitigate the adverse effects of high prices by lowering the savings rate or unloading accumulated savings.
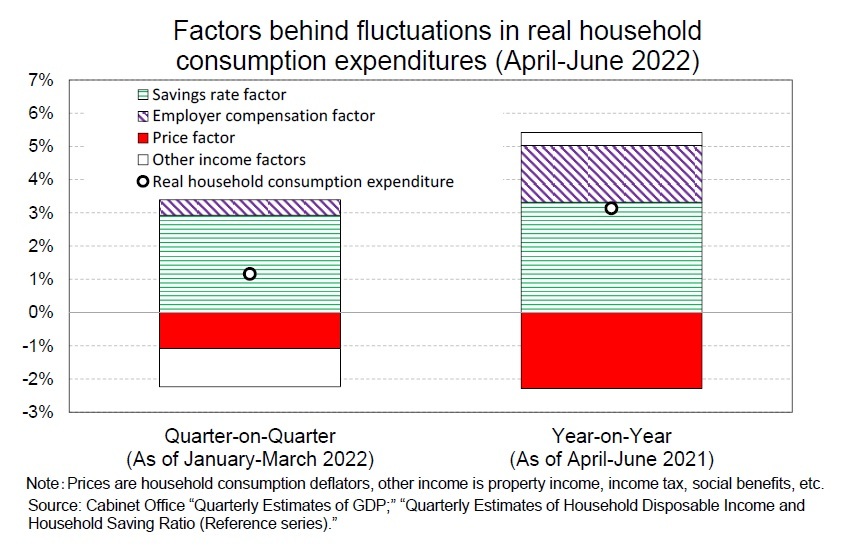 In fact, consumer spending has clearly recovered since the end of the period of priority preventative measures, particularly in face-to-face services such as dining out and travel, which had dropped sharply due to the COVID-19 crisis, even as consumer price inflation soared to the 2% level. In the April–June quarter of 2022, real household consumption expenditure increased by 3.1% year on year and 1.2% quarter on quarter. A rise in the household consumption deflator (2.3% YOY, 1.1% QOQ) contributed to the downward pressure on consumption (price factor), but consumption was significantly boosted by a decline in the savings rate following the lifting of the activity restrictions.1
1 Savings rate for April-June 2022 estimated by NLI Research Institute based on actual figures for household consumption expenditures and employee compensation.
2. Real growth expected to be 1.7% in FY 2022 and 1.6% in FY 2023
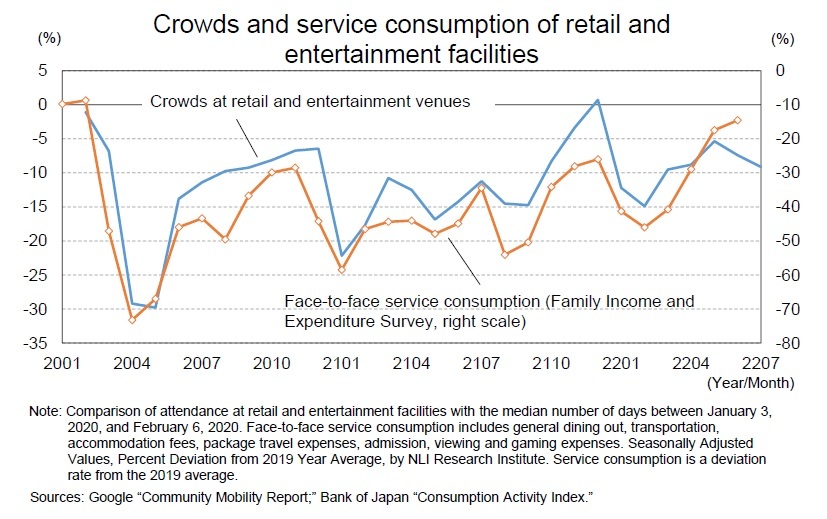
With priority preventative measures ending on March 21, 2022, retail and entertainment turnout, which is closely linked to service consumption, experienced a clear rebound to a level above those in the pre-COVID-19 period during Golden Week in May.
According to the Family Income and Expenditure Survey of the Statistics Bureau in the Ministry of Internal Affairs and Communications, the consumption of face-to-face services (general dining out, transportation, accommodation, package tours, admission, viewing, and games) plunged from the previous month by 15.5% in January and 9.5% in February 2022 in response to the application of priority preventative measures, but surged by 60.0% in the four months from March to June. The index, which was 100 before the COVID-19 crisis (2019 average), recovered to 85.5 in June, its highest level since the pandemic began.
 Since July, a recovery in attendance has stalled amid the spread of COVID-19. The government has not imposed any special restrictions on people’s movements, unlike previous outbreaks where the state of emergency and priority preventative measures were imposed. As a result, crowd numbers have not dropped as significantly as they did during previous outbreaks. Even during the recent outbreak, there was an increase in the number of summer festivals and other events held for the first time in three years, suggesting that the trend is closer to normal. Consumer spending is likely to remain on a recovery track, albeit at a slower pace.
Nominal wages per capita fell sharply in FY 2020 due to the impact of COVID-19 and have continued to rise since the start of FY 2021. However, real wages have experienced negative growth since April 2022 due to a significant increase in the rate of consumer price inflation. The spring wage increase rate in 2022 improved by 0.34 percentage points from the previous year (1.86%) to 2.20% (the status of requests and settlements for spring wage increases by major private companies in the Ministry of Health, Labour and Welfare). The rate of wage increases was higher than the previous year for the first time in four years, but the base increase, excluding regular pay increases of about 1.7 ~ 1.8%, remains in the 0% range. Since consumer prices in FY 2022 are expected to remain in the 2% range, real wage growth is likely to remain in the negative range.
The 2023 spring wage increase is expected to be 2.40%, an improvement of 0.20 percentage points from the previous year. Although corporate earnings growth in FY 2022 will slow significantly from FY 2021 due to rising raw material prices and sluggish exports due to a slowdown in overseas economies, a certain level of price growth in the previous year will help wage increases.
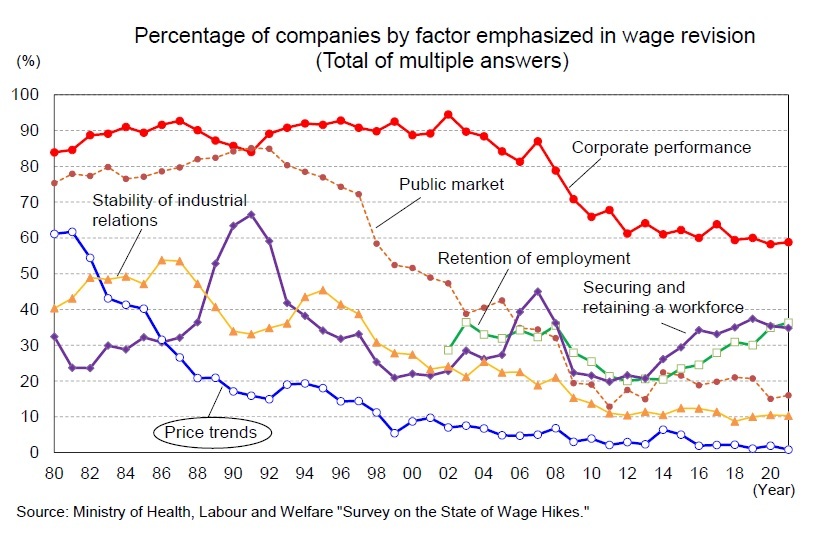 It is important to note, however, that in recent years price trends have rarely been taken into account in wage negotiations. According to the Ministry of Health, Labour and Welfare’s Survey on the State of Wage Hikes, the percentage of companies that emphasized “price trends” when revising wages (multiple answers allowed) exceeded 60% in 1980. This ratio dropped rapidly in response to the price stability that followed, but remained above 10% until the late 1990s. However, after falling below 10% in 1999, it remained in the low single digits for more than 20 years, with a record low of 0.8% in 2021. Although the recent rise in prices may be changing the price-setting behavior of companies, the effect of higher prices on wages is likely to be limited since the increases due to higher raw material prices also create pressure on companies’ earnings.
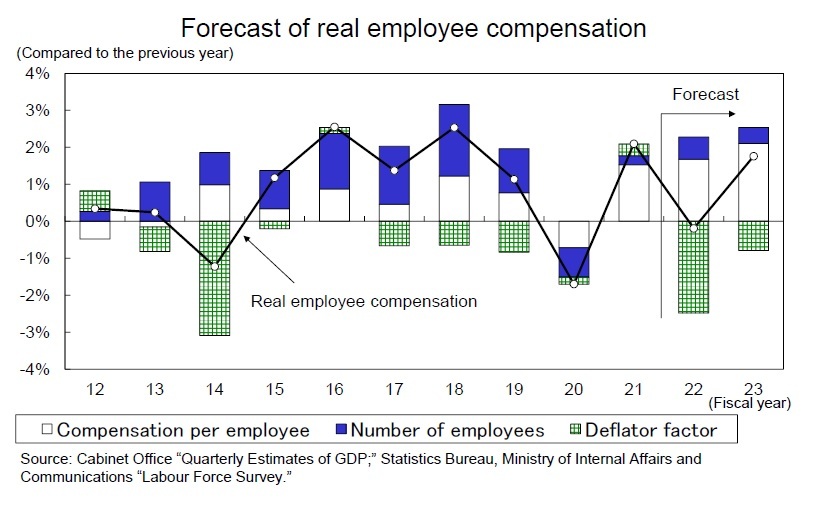 Nominal employee compensation declined 1.5% year on year to FY 2020, the first decline in eight years, and then increased 1.8% to FY 2021. Nominal employee compensation in FY 2022 will increase to 2.3% from the previous year, reflecting higher spring wage increases than the previous year, higher growth in Scheduled Cash Earnings, and an increase in Special Cash Earnings (bonuses), which is closely linked to corporate earnings, as the number of employees continues to increase against the backdrop of a high sense of labor shortages in companies.
At the same time, however, the pace of price increases is expected to accelerate, so real employee pay is expected to decline from 2.1% in FY 2021 to 0.2% in FY 2022, the first decline in three years. With nominal employee pay growing at a brisk 2.5% year on year, FY 2023’s real employee pay will shift to an increase of 1.8% as the pace of price increases slows.
(2022年08月19日「Weekly エコノミスト・レター」)
このレポートの関連カテゴリ

 各種レポート配信をメールでお知らせ。読み逃しを防ぎます!
03-3512-1836
- ・ 1992年:日本生命保険相互会社
・ 1996年:ニッセイ基礎研究所へ
・ 2019年8月より現職
・ 2010年 拓殖大学非常勤講師(日本経済論)
・ 2012年~ 神奈川大学非常勤講師(日本経済論)
・ 2018年~ 統計委員会専門委員
斎藤 太郎のレポート
| 日付 | タイトル | 執筆者 | 媒体 |
|---|---|---|---|
| 2025/10/24 | 消費者物価(全国25年9月)-コアCPI上昇率は拡大したが、先行きは鈍化へ | 斎藤 太郎 | 経済・金融フラッシュ |
| 2025/10/22 | 貿易統計25年9月-米国向け自動車輸出が数量ベースで一段と落ち込む。7-9月期の外需寄与度は前期比▲0.4%程度のマイナスに | 斎藤 太郎 | 経済・金融フラッシュ |
| 2025/10/03 | 雇用関連統計25年8月-失業率、有効求人倍率ともに悪化 | 斎藤 太郎 | 経済・金融フラッシュ |
| 2025/09/30 | 鉱工業生産25年8月-7-9月期は自動車中心に減産の可能性 | 斎藤 太郎 | 経済・金融フラッシュ |


新着記事
-
2025年10月24日
米連邦政府閉鎖と代替指標の動向-代替指標は労働市場減速とインフレ継続を示唆、FRBは政府統計を欠く中で難しい判断を迫られる -
2025年10月24日
企業年金の改定についての技術的なアドバイス(欧州)-EIOPAから欧州委員会への回答 -
2025年10月24日
消費者物価(全国25年9月)-コアCPI上昇率は拡大したが、先行きは鈍化へ -
2025年10月24日
保険業界が注目する“やせ薬”?-GLP-1は死亡率改善効果をもたらすのか -
2025年10月23日
御社のブランドは澄んでますか?-ブランド透明性が生みだす信頼とサステナビリティ開示のあり方(1)
レポート紹介
-
研究領域
-
経済
-
金融・為替
-
資産運用・資産形成
-
年金
-
社会保障制度
-
保険
-
不動産
-
経営・ビジネス
-
暮らし
-
ジェロントロジー(高齢社会総合研究)
-
医療・介護・健康・ヘルスケア
-
政策提言
-
-
注目テーマ・キーワード
-
統計・指標・重要イベント
-
媒体
- アクセスランキング
お知らせ
-
2025年07月01日
News Release
-
2025年06月06日
News Release
-
2025年04月02日
News Release
【JAPAN’s Economic Outlook for Fiscal Years 2022 and 2023 (August 2022)】【シンクタンク】ニッセイ基礎研究所は、保険・年金・社会保障、経済・金融・不動産、暮らし・高齢社会、経営・ビジネスなどの各専門領域の研究員を抱え、様々な情報提供を行っています。
JAPAN’s Economic Outlook for Fiscal Years 2022 and 2023 (August 2022)のレポート Topへ- 新型コロナウイルス
- ウィズコロナ・アフターコロナ
- 生成AI・AI
- IoT
- デジタルトランスフォーメーション(DX)
- フィンテック(FinTech)
- キャッシュレス
- デジタル通貨
- デジタルプラットフォーム
- マイナンバー
- MaaS、CASE
- SDGs
- ESG
- 気候変動
- カーボンニュートラル・脱炭素社会
- サステナビリティ
- ウェルビーイング
- 生物多様性
- イデコ(iDeCo)
- 新NISA・NISA
- 日本銀行
- 人手不足・人材不足
- 働き方改革
- 人的資本経営
- 従業員エンゲージメント
- テレワーク・在宅勤務
- ダイバーシティ(多様性)社会
- 外国人雇用・就労
- 労働政策
- 地域包括ケア・地域共生社会
- 認知症
- 金融(ファイナンシャル)ジェロントロジー
- 全世代型社会保障
- 社会保障・税改革
- 医療・介護制度改革
- 健康寿命
- 健康経営
- 格差・貧困
- 世代間格差
- パワーカップル
- 未婚化
- プレコンセプションケア
- 少子高齢化
- 東京一極集中
- インバウンド
- シェアリングエコノミー
- Z世代・α世代
- エンタメ
- オフィスレントインデックス
- 生命保険事業概況
- 米中貿易摩擦
- 米国
- 中国
- 欧州
- アジア・新興国
- 韓国
- ASEAN
- 統計
- 確定拠出年金
- 企業型DC
- 資産所得倍増プラン
- 金融リテラシー
- 住宅リテラシー
- 年金制度改革
- インド
- 経済安全保障
- 供給網(サプライ・チェーン)
- 消費者物価指数(CPI)│日本
- 雇用統計│日本
- 鉱工業生産指数│日本
- 貿易統計│日本
- 法人企業統計│日本
- QE速報・予測
- 日銀金融政策決定会合
- 日銀短観│日本
- 資金循環統計│日本
- 景気ウォッチャー調査│日本
- 地域経済報告(さくらレポート)
- マネタリーベース│日本
- GDP等│米国
- FOMC(連邦公開市場委員会)│米国
- 住宅販売・着工│米国
- 雇用統計│米国
- 米個人所得・支出|米国
- ECB政策理事会│欧州
- ユーロ圏消費者物価指数
- ユーロ圏GDP
- ユーロ圏失業率
- 英国雇用関連統計
- 英国金融政策
- 英国GDP
- 将来人口推計
- 人口動態統計
- 宿泊旅行統計
- 中国GDP
- インドGDP
- タイGDP
- マレーシアGDP
- フィリピンGDP
- インドネシアGDP
- ベトナムGDP
- ロシアGDP
- ブラジルGDP
- IMF世界経済見通し
- 企業物価指数
- インド消費者物価
Copyright © NLI Research Institute. All rights reserved.