


新着記事をお届け!


Japan’s Economic Outlook for Fiscal 2021 to 2023 (February 2022) | ニッセイ基礎研究所


- シンクタンクならニッセイ基礎研究所 >
- 経済 >
- 経済予測・経済見通し >
- Japan’s Economic Outlook for Fiscal 2021 to 2023 (February 2022)
文字サイズ
- 小
- 中
- 大
1. Annualized growth of 5.4% in the October–December quarter of 2021
For calendar year 2021, real GDP grew 1.7%. It was the first positive growth in 3 years, but the pace of recovery was slow after the sharp negative growth (−4.5%) in 2020. Despite strong growth in the October–December quarter of 2021, real GDP is 0.2% lower than its pre–COVID-19 level in the October–December quarter of 2019. By demand item, government consumption greatly exceeded the pre-pandemic level, reflecting the cost of vaccination and the establishment of the medical care provision system. Private consumption also recovered to its pre–COVID-19 level due to the high growth in the October–December quarter of 2021, but housing investment, capital investment, and public investment were significantly lower than their pre–COVID-19 levels. In addition, although exports of goods have increased on the back of the recovery of overseas economies, exports of goods and services have remained almost unchanged compared to its pre–COVID-19 level because exports of services have been much lower than the pre-pandemic level, mainly due to border restrictions causing a lack of inbound travelers’ demand.
The real GDP annualized growth rate was −10.6% in the October–December quarter of 2019 due to the effect of the consumption tax rate hike. The level of economic activity in Japan had already fallen sharply before the effects of COVID-19 became apparent. Compared to the latest peak in July–September 2019, real GDP in the October–December quarter of 2021 was down 2.9% and private consumption was down 3.5%.
As economic activity around the world continues to normalize, the import price index has been growing at a 40-year high of about 40% year-on-year due to soaring prices of crude oil and other resources caused by concerns about tight supply. Reflecting the recovery of the world economy, export prices have increased by 10% from the previous year, but fall short compared to the import price index. As a result, the terms of trade index (export price index divided by import price index) has fallen sharply.
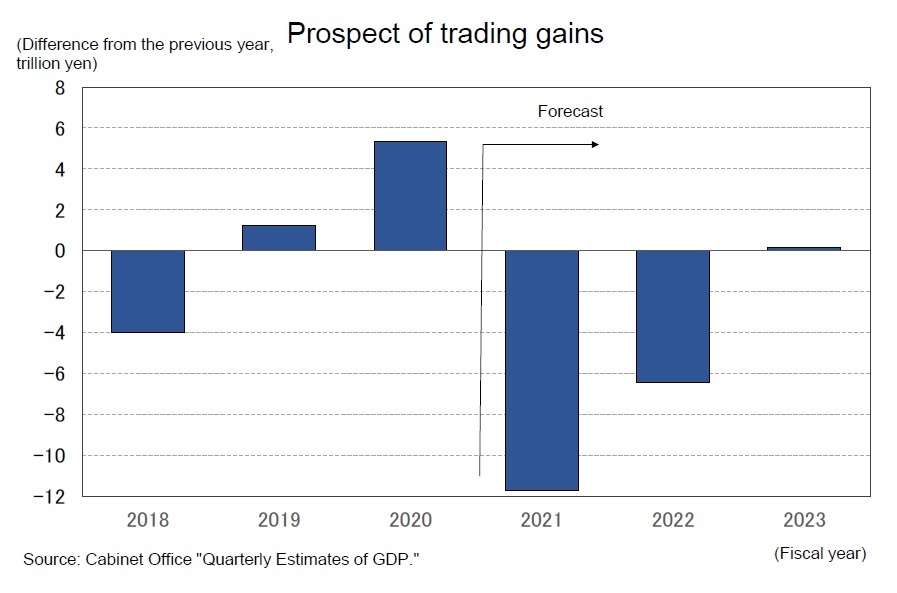 Deterioration in terms of trade means that income is flowing out of Japan. In the GDP statistics, "trading gains" is published as an index to grasp the change in real income (purchasing power) with the change in terms of trade (relative prices of imports and exports), and there is a relationship where "real gross domestic income (GDI) = Real GDP + trading gains".
Trade gains declined throughout 2021 as import deflator growth continued to outpace export deflator growth. As crude oil prices continue to rise in 2022, the decline in trading gains is likely to widen. Trade gains in FY 2021 were down 11.7 trillion yen from the previous year, and according to the current GDP statistics (from FY 1994 onwards), it is expected to be the largest deterioration in history, exceeding the 6.3 trillion yen decrease in FY 2011.
2. Real GDP growth rate is expected to be 2.5% in FY 2021, 2.5% in FY 2022, and 1.7% in FY 2023
Following the lifting of the state of emergency at the end of September 2021, consumption of face-to face services such as dining out, lodging and entertainment, which had been sluggish until then, recovered sharply toward the end of the year.
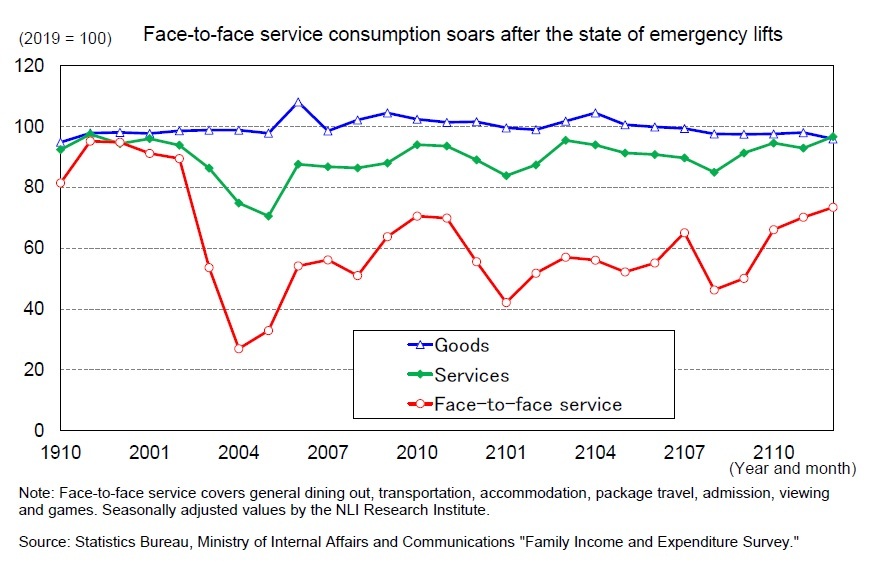 According to a Statistics Bureau, Ministry of Internal Affairs and Communications' Family Income and Expenditure Survey, consumer spending on face-to-face services (general dining, transportation, accommodation fees, package tour fees, admissions, viewing, and game fees) fell by around 50% in January 2021 following the reissuance of the state of emergency, but rebounded sharply in October 2021 to 32.0% compared to the previous month, followed by strong growth in November (6.2%) and December (4.7%). Service consumption in the Bank of Japan's Consumption Activity Index grew about 10% in the 3 months from October 2021. Consumption of face-to-face services reported by both the Family Income and Expenditure Survey and the Consumption Activity Index recovered at the end of 2021 to levels surpassing those seen around the fall of 2020, when Go To Travel was implemented.
The employees’ income environment remains difficult, but the worst is over. The ratio of job openings to job seekers, which reflects the supply–demand relationship in the labor market, fell from 1.64 in January 2019 to 1.04 in October 2020, and then rose to 1.16 in December 2021. The unemployment rate rose from 2.2% in December 2019 to 3.1% in October 2020, but has remained in the upper 2% range since the beginning of 2021.
Per capita wages have been increasing since the beginning of FY 2021 after falling sharply in FY 2020 due to the effects of the pandemic, but have generally remained at a low increase level of 0%. As consumer prices have started to rise, the real wage growth has been negative since September 2021.
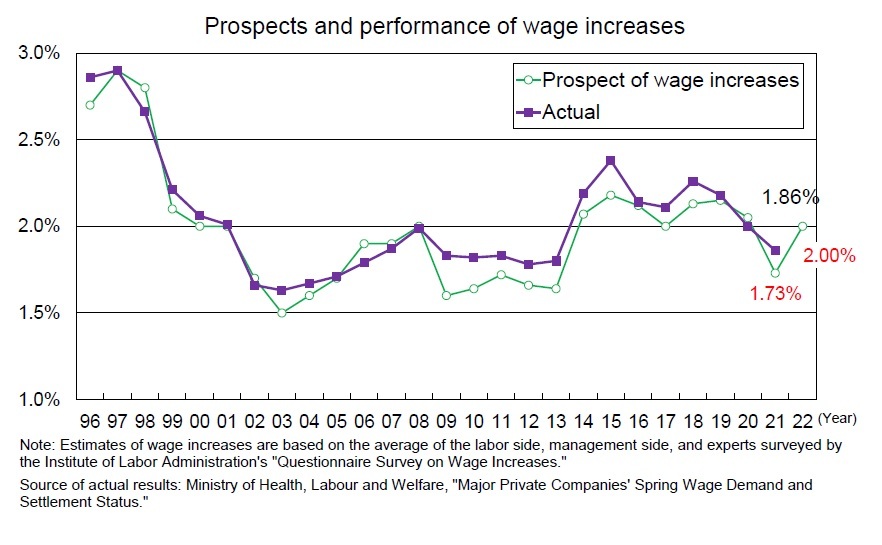 According to a survey (of approximately 500 experts in labor and economic fields) on wage increases released by the Labor Administration Research Institute on February 2nd, 2022, the average wage increase forecast for 2022 is 2.00%, up 0.27 percentage points from the previous year. The spring wage increase rate (labor’s demand and settlement rate of spring wage increase by major private companies) calculated by the Ministry of Health, Labour and Welfare was 1.86% in 2021, falling below 2% for the first time in 8 years. It is likely to return to over 2% in 2022; however, excluding regular pay increases of approximately 1.7–1.8%, the increase is only about 0.2–0.3%. Since consumer prices are expected to continue to increase at the 1% level in FY 2022, it is highly likely that real wage growth (per capita) will remain in the negative range.
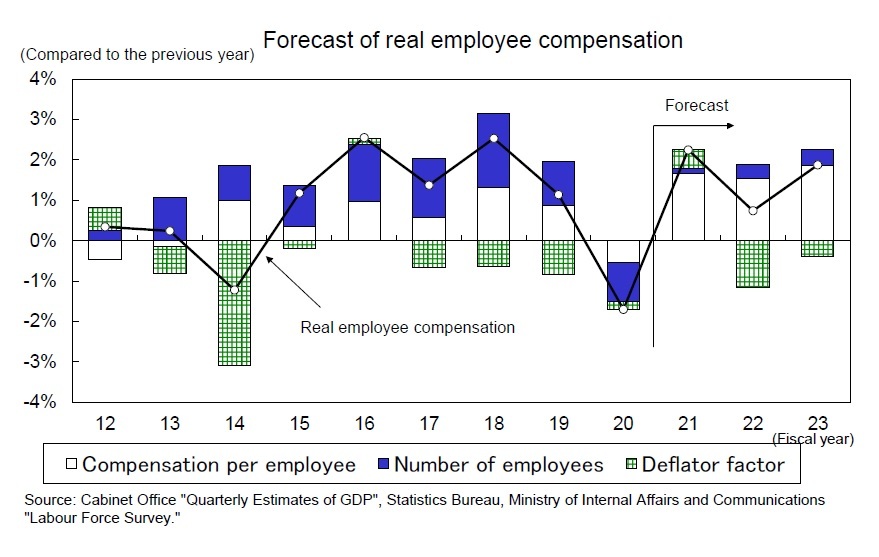 Nominal compensation for employees decreased by 1.5% in FY 2020, the first decrease in 8 years, and is expected to increase by 1.8% in FY 2021. In FY 2022, as the number of employees continues to increase against the backdrop of a strong sense of corporate manpower shortage, nominal compensation for employees will slightly increase by 1.9% from the previous year. This reflects the fact that the wage increase rate in the spring labor negotiation is higher than the previous year for the first time in 3 years, with higher growth in scheduled cash earnings and an increase in special cash earnings (bonus), which is highly linked to corporate profits. At the same time, however, as the pace of price increases accelerates, real employee compensation is expected to decline sharply from 2.2% year-on-year in FY 2021 to 0.7% year-on-year in FY 2022. As the pace of inflation will slow in fiscal 2023, real employee compensation will increase by 1.9%.
In the October–December quarter of 2021, the economy grew at a high annual rate of 5.4% compared to the previous quarter, mainly due to high growth in private consumption, but the situation has changed drastically since the beginning of 2022. In response to the spread of the COVID-19, mainly caused by the Omicron strain, priority preventative measures were applied to Hiroshima, Yamaguchi and Okinawa Prefectures on January 9, 2022, and as of February 16, 2022, the number of prefectures has expanded to 36. Total GDP of the prefectures affected by priority preventative measures accounts for 91% of Japan's total GDP.
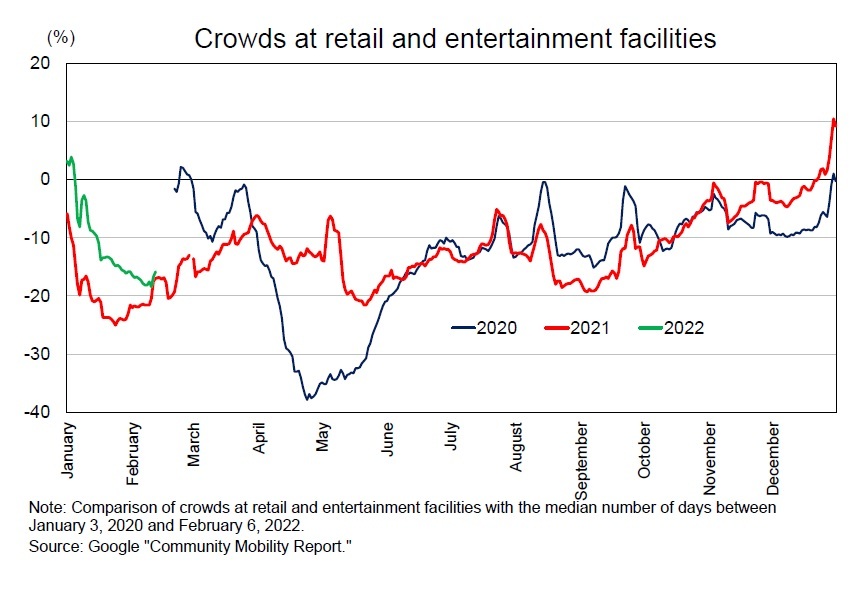 Following the state of emergency's lifting at the end of September 2021, the number of people patronizing retail and entertainment venues picked up and by the end of the year had recovered to surpass pre–COVID-19 levels. However, the sharp increase in the number of infected people and the accompanying effect of priority preventative measures have negatively affected the number of people visiting retail and entertainment venues in 2022. In February, this number approached the level in 2021, when the state of emergency was issued. Consumption of face-to-face services, such as dining out and accommodation, is likely to decline in the January–March quarter of 2022.
In the January–March quarter of 2022, real GDP's private consumption is expected to decrease by 0.4% from the previous quarter. However, the total real GDP is expected to show a slight positive growth of 0.4% per annum from the previous quarter, due to an increase in capital investment reflecting higher corporate profits, an increase in exports on the back of recovery in overseas economies, and higher growth in government consumption reflecting progress in the COVID-19 vaccination campaign. If stricter restrictions on activities are imposed, consumption will fall further, increasing the risk of negative growth.
From the April–June quarter of 2022 onwards, growth is expected to continue to exceed the potential growth rate in the mid 0% range, given that the COVID-19 infection rate has subsided and measures such as the state of emergency and priority preventative measures will likely not been taken. If restrictions on economic activities are removed, it can be expected that consumption of face-to-face services, such as dining out and travel, will increase significantly by increasing the propensity to consume. However, there is a great deal of uncertainty regarding the trend of infection and measures to deal with it.
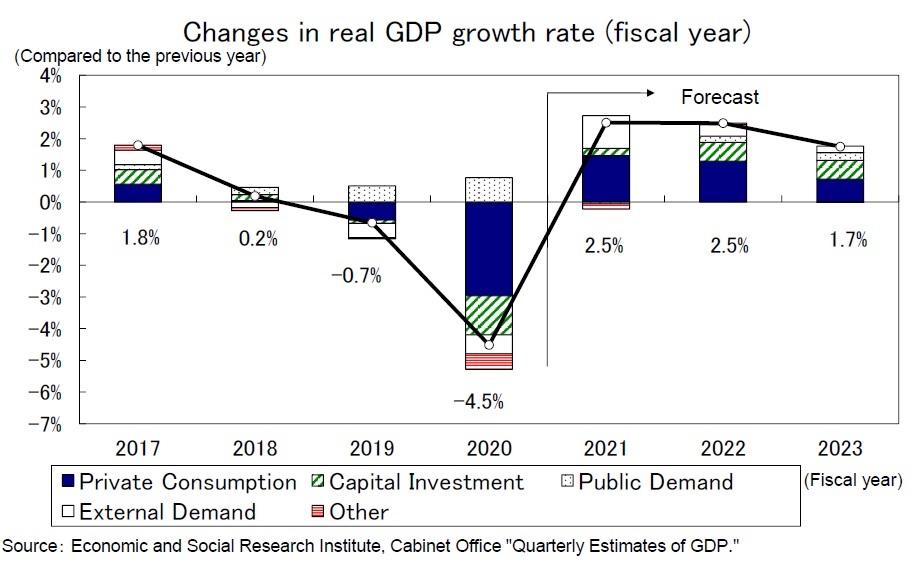 Real GDP’s growth rate is expected to be 2.5% in FY 2021, 2.5% in FY 2022 and 1.7% in FY 2023. Even if restrictions on economic activity are lifted, it will take time for consumption to recover in earnest because a certain level of concern about infectious diseases will curb consumption of face-to-face services. Private consumption is expected to increase 2.7% in FY 2021, 2.4% in FY 2022, and 1.3% in FY 2023, which are relatively sluggish given the sharp decline of 5.4% in FY 2020. The level of private consumption on a fiscal year basis will not exceed the latest peak (FY 2018) until FY 2024.
However, as corporate profits continue to improve, capital investment is expected to increase from −7.5% in FY 2020 to 1.4% in FY 2021, and to maintain a high growth rate of 3.8% in FY 2022 and 3.7% in FY 2023. According to the Bank of Japan’s Tankan survey conducted in December 2021, the capital investment plan (total scale and industry, including software investment, excluding land investment) for FY 2021 increased 9.6% from the previous year’s level, far exceeding the 3.2% decrease in the same period of the previous year’s survey (the FY 2020 plan in the December 2020 survey). A breakdown of capital investment shows that software investment to cope with labor shortages and to expand telework is the main driver.
Looking ahead, investment in the face-to-face service industry, which faces a very difficult earnings environment, is expected to continue to be a negative factor, but an overall increasing trend is expected to continue, particularly in machinery investment and digital-related investment in the manufacturing industry.
Exports weakened in the second half of 2021 due to supply constraints such as a shortage of semiconductors and difficulty in procuring parts from Southeast Asia, but have been on a recovery trend. As for the future, the upward trend will become clearer on the back of the recovery of overseas economies as the effects of supply constraints ease. In FY 2020, exports were down 10.5% from the previous year in FY 2021, but after growing 12.6% in FY 2021, exports will remain strong at 4.5% in FY 2022 and 3.9% in FY 2023, which will boost the growth rate.
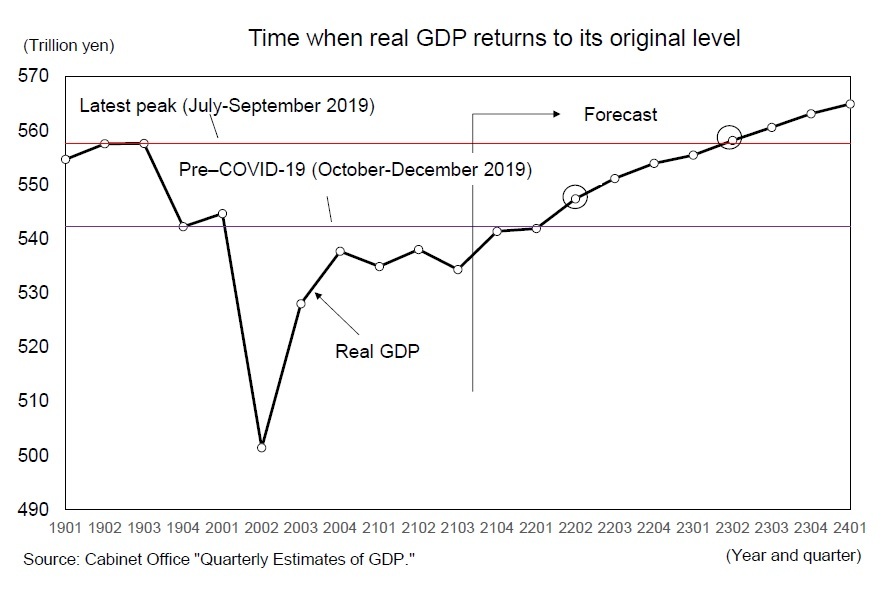 Real GDP recovered to a level of 0.2% below its 2019 pre–COVID-19 level in the October–December quarter of 2021, but rowth in January–March 2022 will be only 0.1% compared to the previous quarter (0.4% per annum), so it will not surpass its pre-pandemic level until April–June 2022.
In Japan, the level of economic activity had fallen sharply before the COVID-19 pandemic because of the consumption tax rate hike, so simply returning to the level before the pandemic would not be considered normalization of the economy. Real GDP is not expected to recover to the level of its most recent peak during July–September 2019 until the April–June quarter of 2023.
The Japanese economy will continue to be affected by the COVID-19 outbreak and its countermeasures. At first, Japan’s delayed vaccination campaign in comparison to other countries was thought to be the main culprit of the slow economic recovery. By the autumn of 2021, however, even though the rate of vaccination (two doses) had risen to a level of or above those in other major developed countries, the emergence and spread of the Omicron strain had led to a renewed tightening of restrictions on activities.
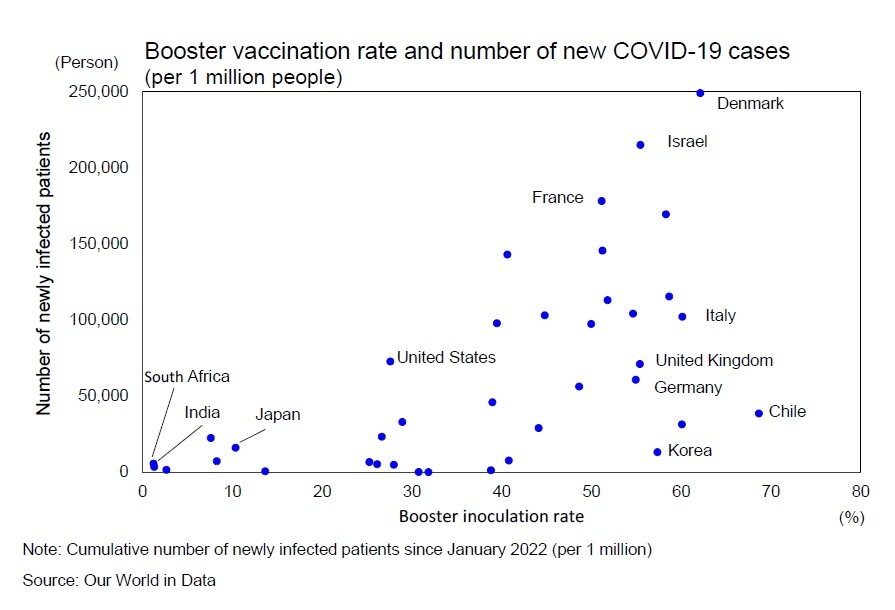 Currently, the government is actively promoting the third booster inoculation, but the spread of COVID-19 is not necessarily controlled in countries where the booster inoculation has been widely administered. Even after the surge in infection brought about by the Omicron strain has passed, it is quite possible that the number of infected people will increase again with the emergence of new variants. If the government tightens restrictions as it has in the past, economic activity, particularly consumer spending, will stagnate again. On the other hand, if a flexible system for providing medical care tailored to the characteristics of the variant (e.g., infectivity, toxicity, etc.) is established, the need to restrict economic activities may be reduced even if the number of infected patients increases, and the economy may be greatly boosted.
(2022年02月24日「Weekly エコノミスト・レター」)
このレポートの関連カテゴリ

 各種レポート配信をメールでお知らせ。読み逃しを防ぎます!
03-3512-1836
- ・ 1992年:日本生命保険相互会社
・ 1996年:ニッセイ基礎研究所へ
・ 2019年8月より現職
・ 2010年 拓殖大学非常勤講師(日本経済論)
・ 2012年~ 神奈川大学非常勤講師(日本経済論)
・ 2018年~ 統計委員会専門委員
斎藤 太郎のレポート
| 日付 | タイトル | 執筆者 | 媒体 |
|---|---|---|---|
| 2025/10/31 | 2025年7-9月期の実質GDP~前期比▲0.7%(年率▲2.7%)を予測~ | 斎藤 太郎 | Weekly エコノミスト・レター |
| 2025/10/31 | 鉱工業生産25年9月-7-9月期の生産は2四半期ぶりの減少も、均してみれば横ばいで推移 | 斎藤 太郎 | 経済・金融フラッシュ |
| 2025/10/31 | 雇用関連統計25年9月-女性の正規雇用比率が50%に近づく | 斎藤 太郎 | 経済・金融フラッシュ |
| 2025/10/30 | 潜在成長率は変えられる-日本経済の本当の可能性 | 斎藤 太郎 | 基礎研レポート |


新着記事
-
2025年11月04日
数字の「26」に関わる各種の話題-26という数字で思い浮かべる例は少ないと思われるが- -
2025年11月04日
ユーロ圏消費者物価(25年10月)-2%目標に沿った推移が継続 -
2025年11月04日
米国個人年金販売額は2025年上半期も過去最高記録を更新-但し保有残高純増は別の課題- -
2025年11月04日
パワーカップル世帯の動向(2)家庭と働き方~DINKS・子育て・ポスト子育て、制度と夫婦協働が支える -
2025年11月04日
「ブルー寄付」という選択肢-個人の寄付が果たす、資金流入の突破口
お知らせ
-
2025年07月01日
News Release
-
2025年06月06日
News Release
-
2025年04月02日
News Release
【Japan’s Economic Outlook for Fiscal 2021 to 2023 (February 2022) 】【シンクタンク】ニッセイ基礎研究所は、保険・年金・社会保障、経済・金融・不動産、暮らし・高齢社会、経営・ビジネスなどの各専門領域の研究員を抱え、様々な情報提供を行っています。
Japan’s Economic Outlook for Fiscal 2021 to 2023 (February 2022) のレポート Topへ- 新型コロナウイルス
- ウィズコロナ・アフターコロナ
- 生成AI・AI
- IoT
- デジタルトランスフォーメーション(DX)
- フィンテック(FinTech)
- キャッシュレス
- デジタル通貨
- デジタルプラットフォーム
- マイナンバー
- MaaS、CASE
- SDGs
- ESG
- 気候変動
- カーボンニュートラル・脱炭素社会
- サステナビリティ
- ウェルビーイング
- 生物多様性
- イデコ(iDeCo)
- 新NISA・NISA
- 日本銀行
- 人手不足・人材不足
- 働き方改革
- 人的資本経営
- 従業員エンゲージメント
- テレワーク・在宅勤務
- ダイバーシティ(多様性)社会
- 外国人雇用・就労
- 労働政策
- 地域包括ケア・地域共生社会
- 認知症
- 金融(ファイナンシャル)ジェロントロジー
- 全世代型社会保障
- 社会保障・税改革
- 医療・介護制度改革
- 健康寿命
- 健康経営
- 格差・貧困
- 世代間格差
- パワーカップル
- 未婚化
- プレコンセプションケア
- 少子高齢化
- 東京一極集中
- インバウンド
- シェアリングエコノミー
- Z世代・α世代
- エンタメ
- オフィスレントインデックス
- 生命保険事業概況
- 米中貿易摩擦
- 米国
- 中国
- 欧州
- アジア・新興国
- 韓国
- ASEAN
- 統計
- 確定拠出年金
- 企業型DC
- 資産所得倍増プラン
- 金融リテラシー
- 住宅リテラシー
- 年金制度改革
- インド
- 経済安全保障
- 供給網(サプライ・チェーン)
- 消費者物価指数(CPI)│日本
- 雇用統計│日本
- 鉱工業生産指数│日本
- 貿易統計│日本
- 法人企業統計│日本
- QE速報・予測
- 日銀金融政策決定会合
- 日銀短観│日本
- 資金循環統計│日本
- 景気ウォッチャー調査│日本
- 地域経済報告(さくらレポート)
- マネタリーベース│日本
- GDP等│米国
- FOMC(連邦公開市場委員会)│米国
- 住宅販売・着工│米国
- 雇用統計│米国
- 米個人所得・支出|米国
- ECB政策理事会│欧州
- ユーロ圏消費者物価指数
- ユーロ圏GDP
- ユーロ圏失業率
- 英国雇用関連統計
- 英国金融政策
- 英国GDP
- 将来人口推計
- 人口動態統計
- 宿泊旅行統計
- 中国GDP
- インドGDP
- タイGDP
- マレーシアGDP
- フィリピンGDP
- インドネシアGDP
- ベトナムGDP
- ロシアGDP
- ブラジルGDP
- IMF世界経済見通し
- 企業物価指数
- インド消費者物価
Copyright © NLI Research Institute. All rights reserved.