


- シンクタンクならニッセイ基礎研究所 >
- 経済 >
- 経済予測・経済見通し >
- Japan's Economic Outlook for Fiscal 2021 to 2023
2021年11月24日


文字サイズ
- 小
- 中
- 大
1. In the July–September period of 2021, real GDP decreased by an annualized rate of 3.0% from the previous period
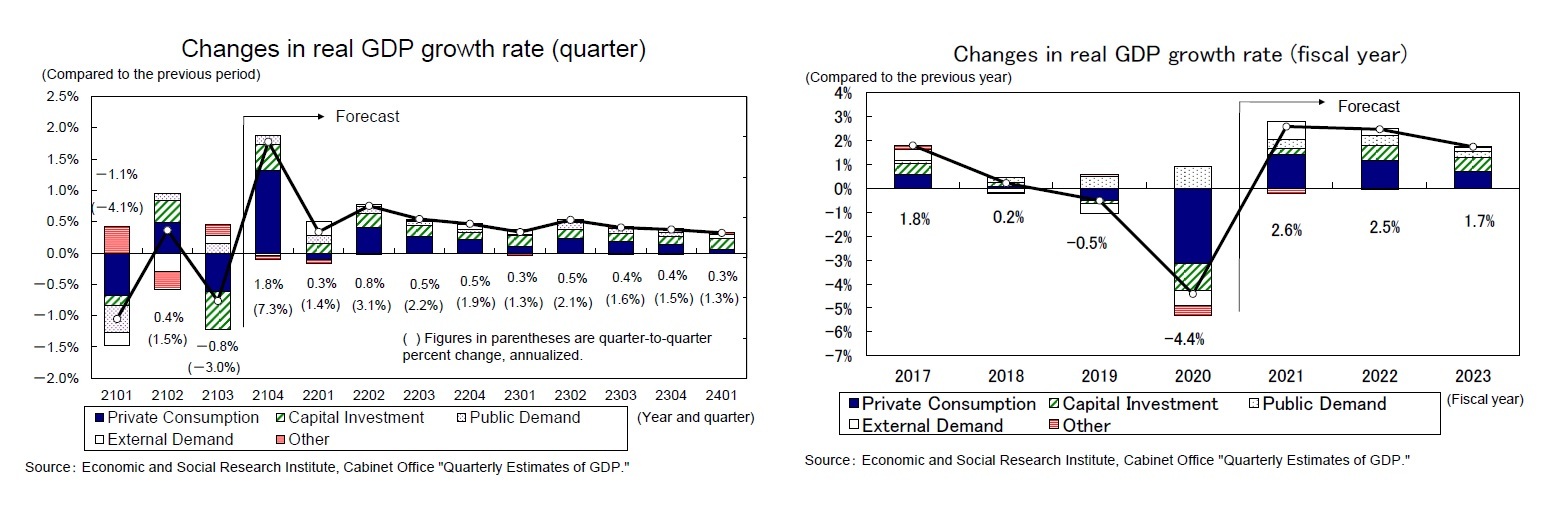
In the July–September quarter of 2021, real GDP posted minus growth of 0.8% (annual rate of 3.0%) for the first time in two quarters.
The contribution of external demand slightly pushed up the growth rate to 0.1% (annual rate of 0.4%) from the previous quarter, but private consumption (down 1.1%), housing investment (down 2.6%), and capital investment (down 3.8%) all decreased significantly due to supply constraints such as prolonged the state of emergency and semiconductor shortage, and private demand decreased for the first time in two quarters. Public demand increased for two consecutive quarters as government consumption increased by 1.1% from the previous quarter, reflecting progress in vaccination, but this did not cover the decline in private demand.
The Japanese economy grew at a double-digit annual rate for two consecutive quarters after the largest negative growth in the April–June quarter of 2020 due to the effects of the coronavirus disease, but has been stagnant since the start of 2021 when the state of emergency was reissued.
(Increasing outflow of income overseas due to deterioration in terms of trade)
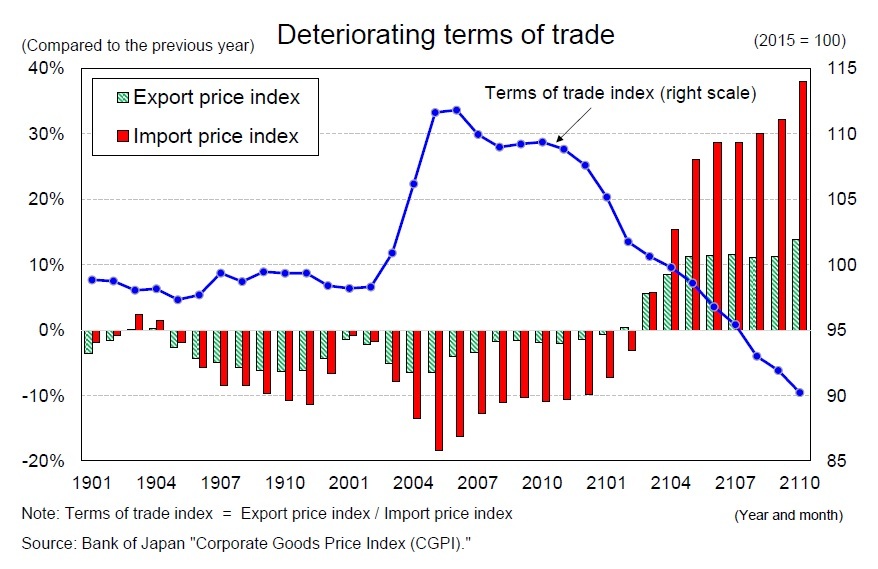
As economic activity around the world continues to normalize, prices of crude oil and other resources are soaring. The import price index in October 2021 was up 38.0% year-on-year, the highest increase in about 40 years since July 1980 (40.0% year-on-year). Although export prices have been rising reflecting the recovery of the world economy, it rose by 13.7% in October 2021, much lower than the import price rise. As a result, the terms of trade index (export price index/import price index) has fallen sharply.
As economic activity around the world continues to normalize, prices of crude oil and other resources are soaring. The import price index in October 2021 was up 38.0% year-on-year, the highest increase in about 40 years since July 1980 (40.0% year-on-year). Although export prices have been rising reflecting the recovery of the world economy, it rose by 13.7% in October 2021, much lower than the import price rise. As a result, the terms of trade index (export price index/import price index) has fallen sharply.
 Deterioration in terms of trade means that income is flowing out of Japan to other countries. In the GDP statistics, "trading gains" is published as an index to grasp the change in real income (purchasing power) with the change in terms of trade (relative prices of imports and exports), and there is a relationship that "real gross domestic income (GDI) = Real GDP + trading gains."
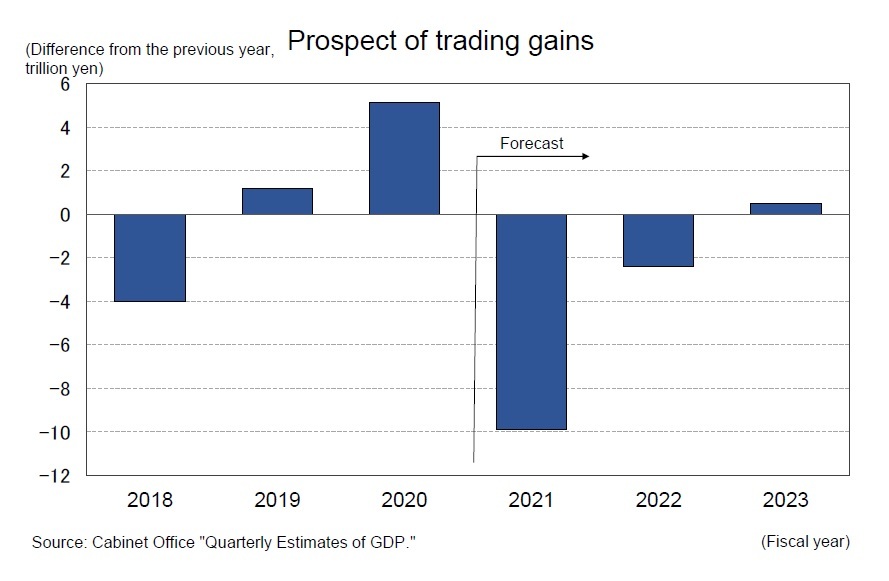 As the growth of the import deflator continues to exceed the growth of the export deflator, the trade gain has been decreasing sharply, by 3.7 trillion yen in January–March 2021, by 2.2 trillion yen in April–June, and by 3.2 trillion yen in July–September. As the pace of increase in import prices has accelerated since October, the negative trade gains are likely to widen further. Trade gains in fiscal 2021 will be down 9.9 trillion yen from the previous year, and according to the current GDP statistics (from fiscal 1994 onwards), it is expected to be the largest deterioration in history, exceeding the 6.3 trillion yen decrease in fiscal 2011.
Companies and households will bear the burden of outflow of income to foreign countries due to deteriorating terms of trade. If companies fail to pass on higher costs associated with higher import prices, corporate profits will be squeezed, and if they pass on prices sufficiently, the burden on companies will be reduced, while the burden on households will increase through higher consumer prices.
While the prices of business-to-business transactions (import prices, domestic corporate goods price) are rising sharply, the consumer price inflation rate remains at almost zero percent. At present, the household burden of import price increases remains limited. However, energy (electricity, gas, kerosene and gasoline), for which fluctuations in fuel costs are easily passed on to consumers, has already risen sharply. As electricity and gas prices, which are affected by high crude oil prices, will rise belatedly in the future, the burden on households is likely to increase further.
While the prices of business-to-business transactions (import prices, domestic corporate goods price) are rising sharply, the consumer price inflation rate remains at almost zero percent. At present, the household burden of import price increases remains limited. However, energy (electricity, gas, kerosene and gasoline), for which fluctuations in fuel costs are easily passed on to consumers, has already risen sharply. As electricity and gas prices, which are affected by high crude oil prices, will rise belatedly in the future, the burden on households is likely to increase further.
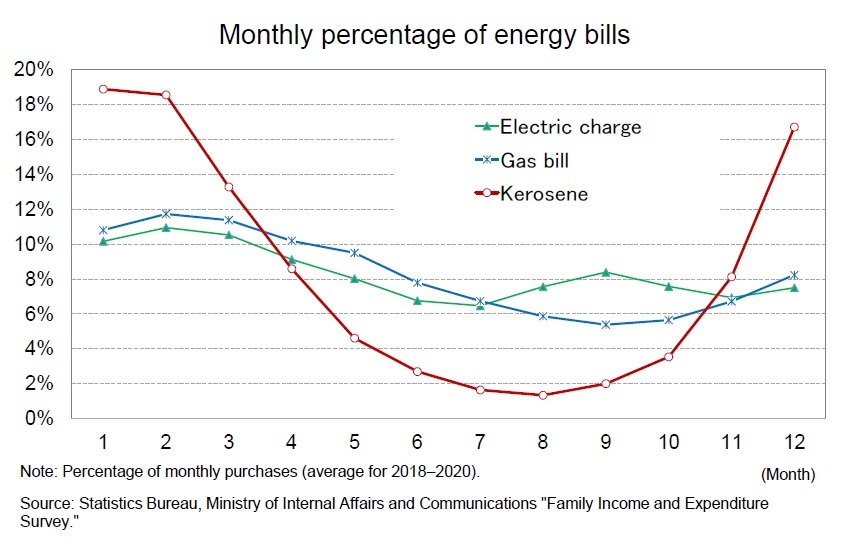 The purchase amount of energy increases greatly in winter. The amount of kerosene purchased increased sharply from November, accounting for more than half of the annual purchase in the 3 months from December to February. The amount of energy purchased varies greatly from region to region. Many people buy gasoline in rural areas due to high automobile ownership, while many buy kerosene in Hokkaido, Tohoku and Hokuriku, where winter temperatures are lower and heating demand is high.
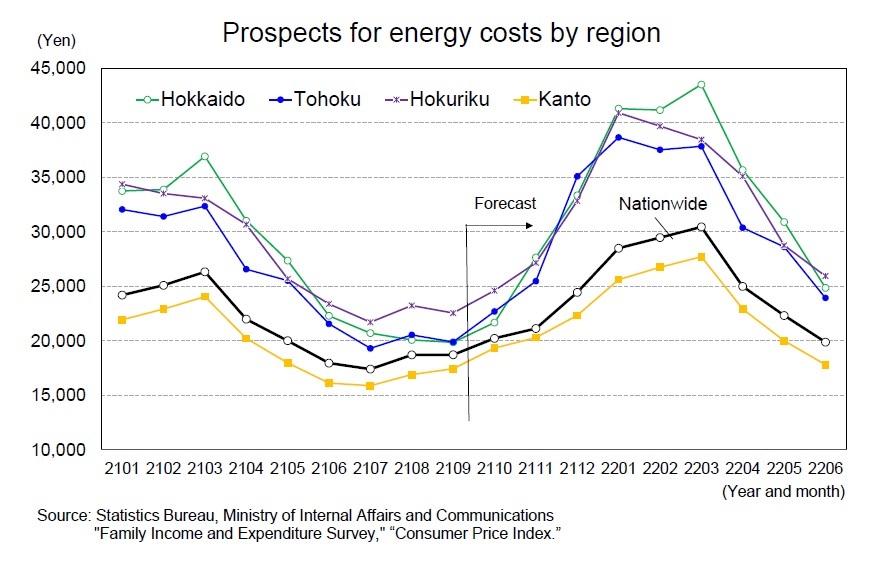 Energy prices in consumer price index are expected to increase from 7.4% year-on-year in September 2021 to nearly 20% towards the end of the year. Taking into account monthly energy purchases, the cost of energy per household will increase from about 19,000 yen in September 2021 to about 30,000 yen in March 2022. In contrast, in the cold regions of Hokkaido, Tohoku and Hokuriku, energy costs soar to about 40,000 yen in winter. Since energy costs are close to the necessities of life, it is difficult to reduce purchases as prices rise. There is a risk that refraining from selective expenditure other than energy, especially in cold regions, will suppress overall consumption.
2. Real GDP growth rate is expected to be 2.6% in FY 2021, 2.5% in FY 2022 and 1.7% in FY 2023
(Service consumption will pick up after the state of emergency's cancellation)
In Japan, the state of emergency and priority preventative measures had been in effect for most of 2021, but both were lifted at the end of September, and on October 25th, 4 prefectures in the Tokyo metropolitan area and Osaka prefecture lifted their requests for restaurants to shorten their business hours.
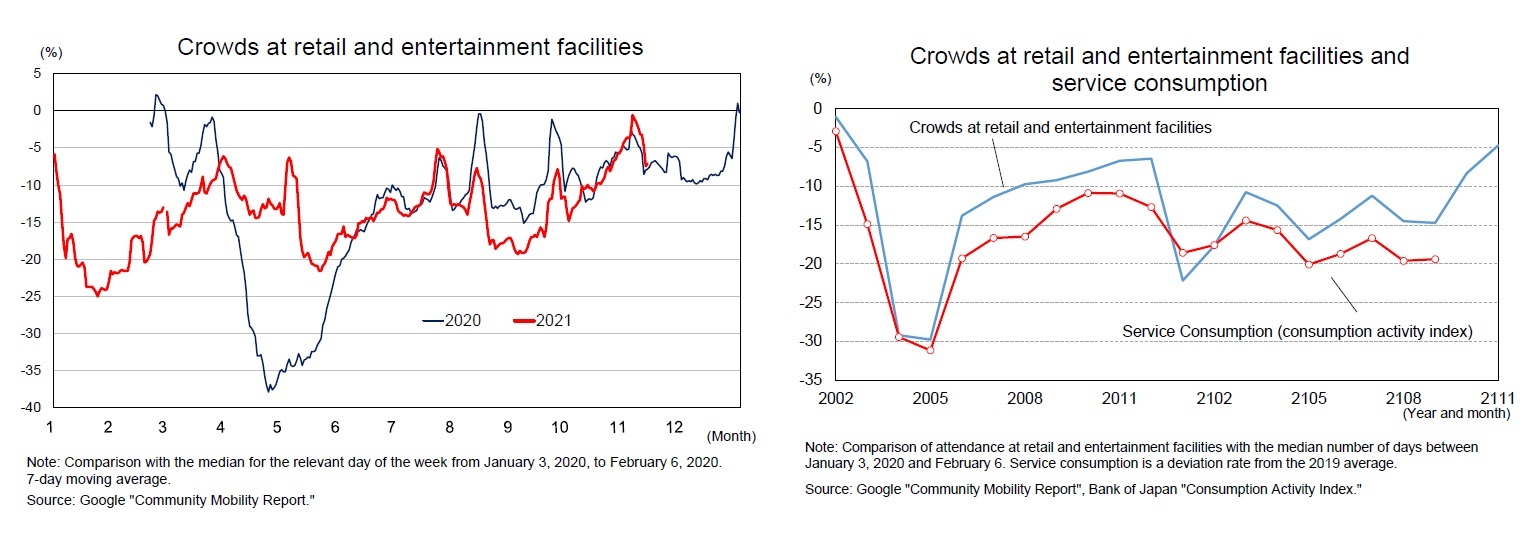
According to the Google's Community Mobility Report, attendance at retail and entertainment venues (for restaurants, cafes, shopping centers, theme parks, movie theaters, etc.) decreased significantly from August to September 2021 in response to the expansion of coverage in the state of emergency, but the pace of decrease slowed as the number of people testing positive for COVID-19 dropped and the state of emergency lifted its restrictions.
Although few consumption-related indicators have been released since October, when the state of emergency was lifted, service consumption, which is closely linked to crowds, is expected to pick up. However, a closer look at the human flow data shows that the number of visitors since October 2021 is almost the same as that of the previous year, suggesting that the sense of alarm over infectious diseases has not been completely eliminated. Consumption of face-to-face services such as dining out and travel will take time to return to pre-coronavirus levels.
In Japan, the state of emergency and priority preventative measures had been in effect for most of 2021, but both were lifted at the end of September, and on October 25th, 4 prefectures in the Tokyo metropolitan area and Osaka prefecture lifted their requests for restaurants to shorten their business hours.
According to the Google's Community Mobility Report, attendance at retail and entertainment venues (for restaurants, cafes, shopping centers, theme parks, movie theaters, etc.) decreased significantly from August to September 2021 in response to the expansion of coverage in the state of emergency, but the pace of decrease slowed as the number of people testing positive for COVID-19 dropped and the state of emergency lifted its restrictions.
Although few consumption-related indicators have been released since October, when the state of emergency was lifted, service consumption, which is closely linked to crowds, is expected to pick up. However, a closer look at the human flow data shows that the number of visitors since October 2021 is almost the same as that of the previous year, suggesting that the sense of alarm over infectious diseases has not been completely eliminated. Consumption of face-to-face services such as dining out and travel will take time to return to pre-coronavirus levels.

(High levels of savings, cash and deposits can significantly boost consumption)
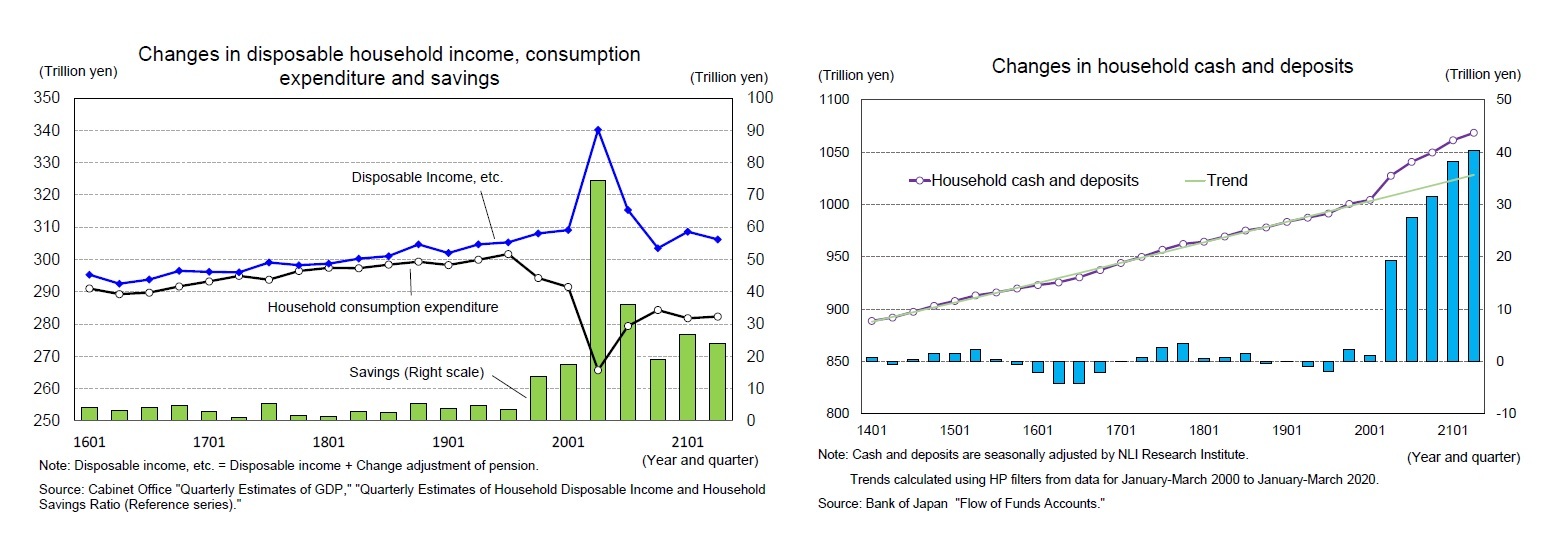
Household savings increased sharply to 74.5 trillion yen (seasonally adjusted, annualized value) in the April–June quarter of 2020 mainly due to the provision of special flat-rate benefits, and then decreased to 24 trillion yen in the April–June quarter of 2021. However, the amount is still far above pre-coronavirus levels. Disposable income has greatly decreased since its peak due to the full impact of the special flat-rate benefits, but the household savings rate has remained higher than usual due to restrictions on activities imposed by the state of emergency and others. The average household savings rate was 1.3% between fiscal 2015 and 2019, but jumped to 12.1% in fiscal 2020. On a quarterly basis, it rose to an extremely high level of 21.9% in the April–June quarter of 2020, and then fell to 7.8% in the April–June quarter of 2021, but the level is higher than in normal times.
As a result of the accumulation of flow savings, household cash and deposits as stock also increased significantly. The balance of cash and deposits in households increased at an annual pace of 10 to 20 trillion yen before the corona and exceeded 1,000 trillion yen at the end of 2019, and the pace of increase has accelerated due to the increase in savings from the coronavirus disaster. The balance of cash and deposits in the April–June quarter of 2021 was about 1,070 trillion yen, which is deviated from the pre-coronavirus trend by about 40 trillion yen.
This means that consumer spending will recover rapidly only if the savings rate returns to a level close to normal as a result of the easing of action restrictions. Moreover, if households withdraw cash and deposits they have accumulated so far, the rate of savings in cash flows could fall sharply, pushing up the level of consumption dramatically.

(Real GDP will surpass its most recent peak in FY 2023)
In 2020, the Japanese economy fell sharply in the first half of the year due to calls for self-restraint in the wake of the coronavirus outbreak and the issuance of the state of emergency order, but recovered at a faster pace than expected in the second half due to the resumption of economic activity following the lifting of the state of emergency order. However, with the reissuance of the state of emergency, economic activity remained sluggish from the beginning of 2021.
In the October–December quarter of 2021, we expect a high annual growth rate of 7.3%. Although exports, particularly of automobiles, will be sluggish due to the lingering effects of supply constraints, private consumption is expected to grow at a high rate of 2.5% from the previous quarter because consumption of face-to-face services, such as dining out and travel, will recover following the lifting of the state of emergency. Capital investment, which declined in the July–September quarter, is likely to turn upward in the October–December quarter, as corporate profits continue to improve.
Looking ahead, economic activity will continue to be heavily influenced by the coronavirus outbreak and the corresponding public health measures. Currently, the infection has been very limited in Japan, but the number of people infected with the virus has been rising again in Germany and the Netherlands.
In Japan, there is no denying the possibility that the number of infected people will increase in the future due to the emergence of new variants and changes in temperature, and if action restrictions are tightened as in the past, there is a risk that economic activity will stagnate again, particularly in the consumption of face-to-face services. On the other hand, if sufficient progress is made in the expansion of the medical system and the appropriate allocation of medical resources, even if the number of infected patients increases to a certain extent, the need to restrict economic activities strictly will decrease, and the economy may greatly improve.
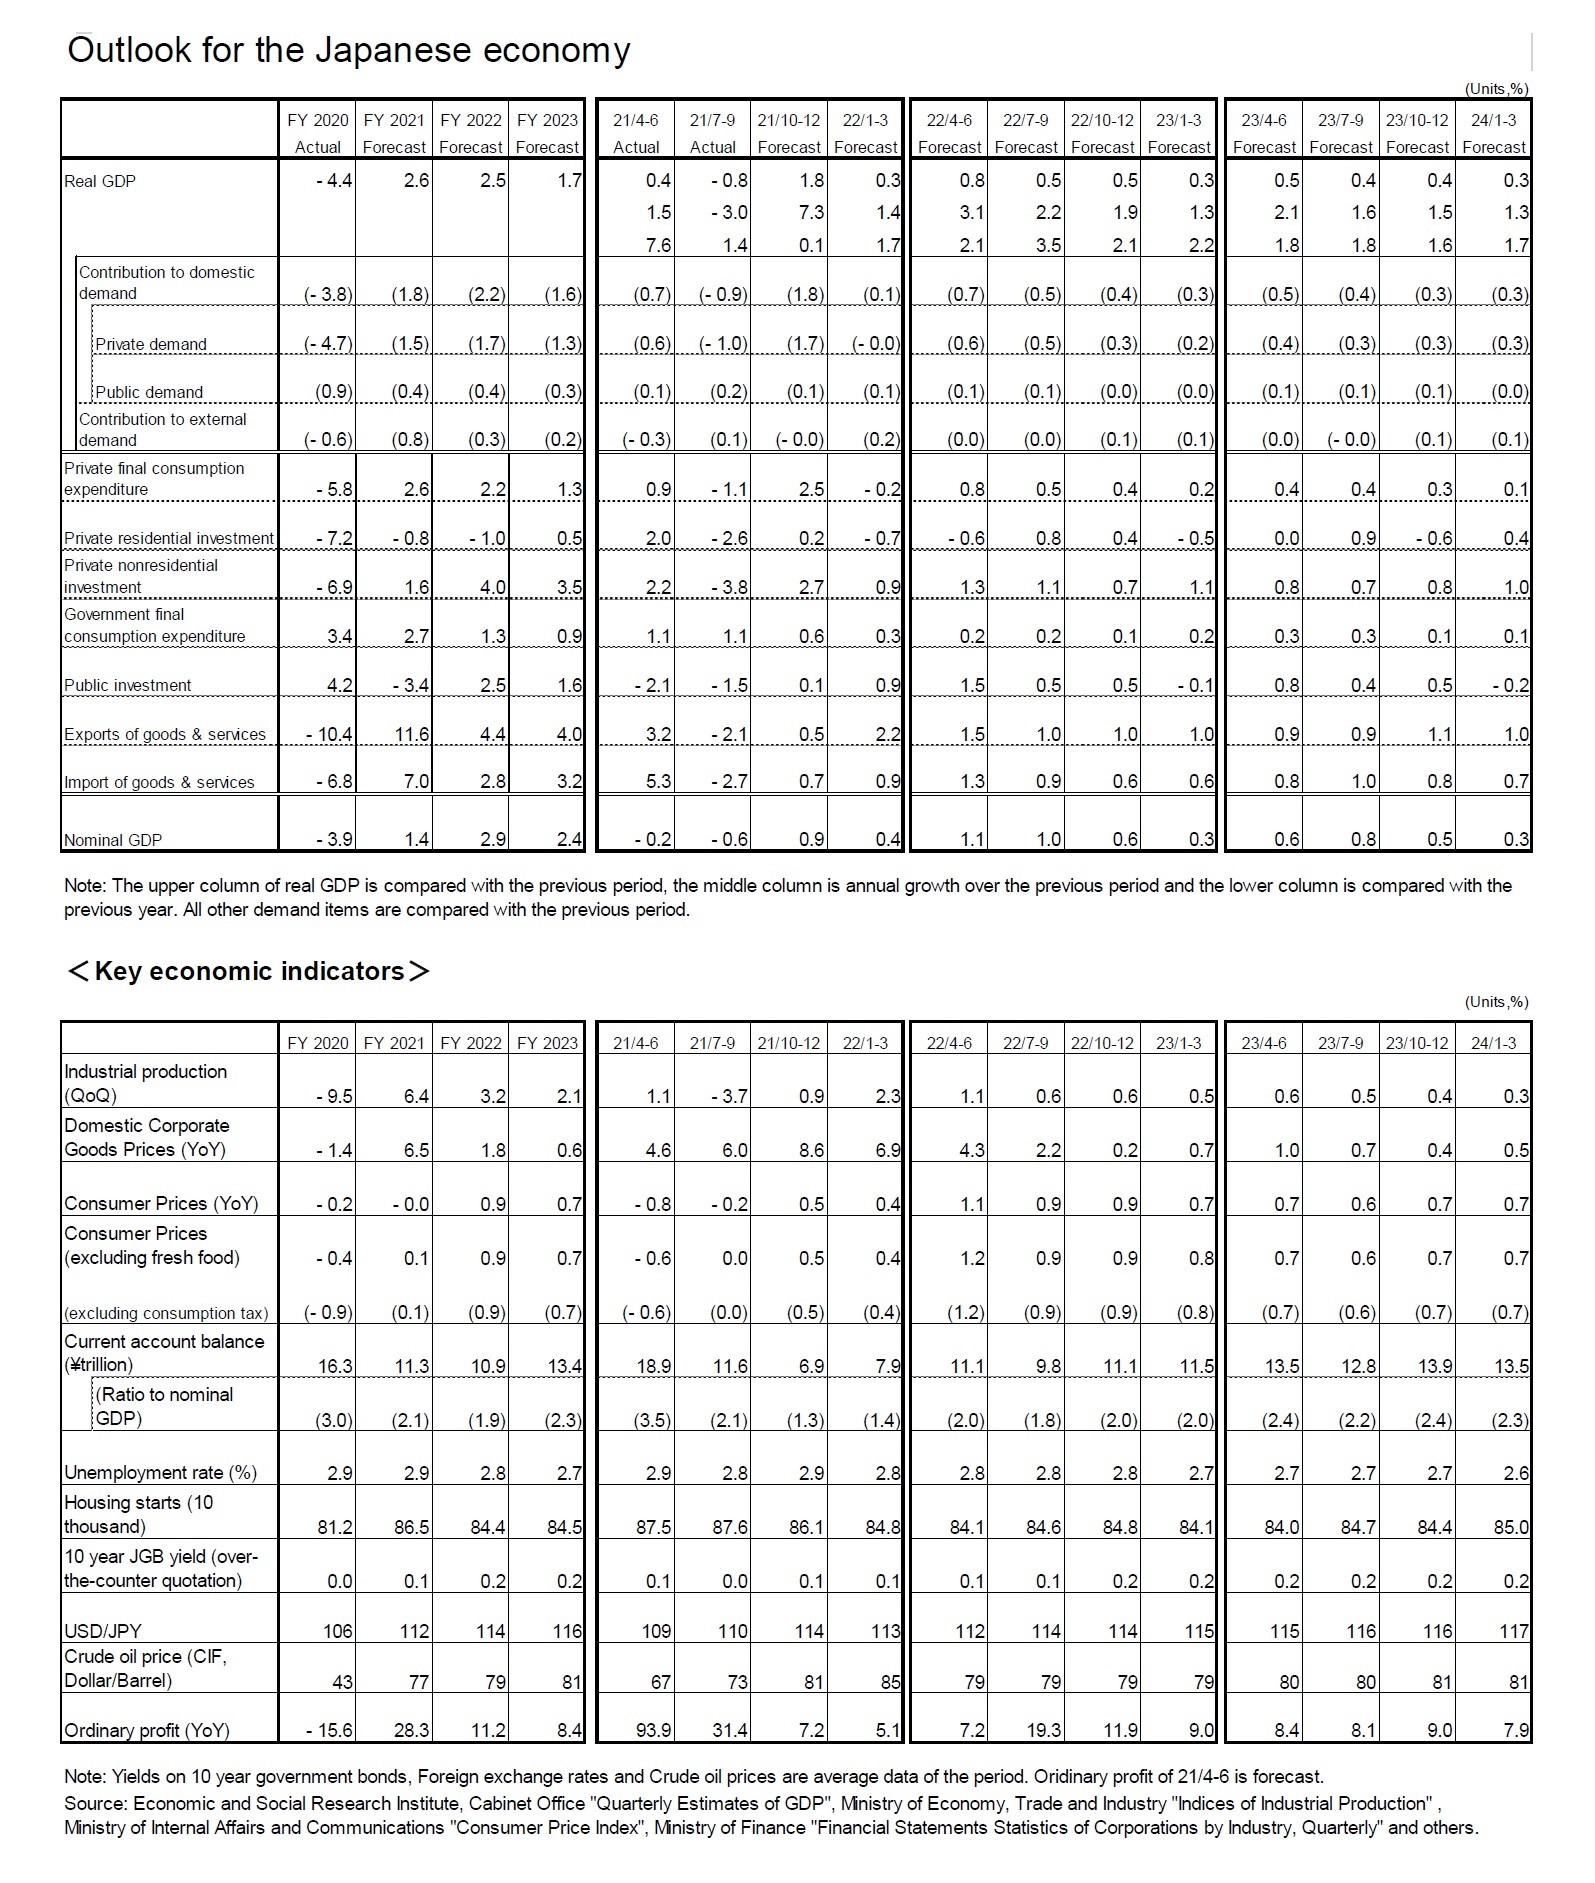
The real GDP growth rate is expected to be 2.6% in FY 2021, 2.5% in FY 2022, and 1.7% in FY 2023. Even if restrictions on economic activities are eased, consumer spending will not recover in earnest because a certain level of concern about infectious diseases will curb consumption of face-to-face services. Private consumption saw a sharp decline of 5.8% in FY 2020 and it is expected to increase 2.6% in FY 2021, 2.2% in FY 2022, and 1.3% in FY 2023. On the one hand, the pace of recovery of consumption is quite slow. The level of private consumption on a fiscal year basis will not exceed the latest peak (FY 2018) until FY 2024.
In 2020, the Japanese economy fell sharply in the first half of the year due to calls for self-restraint in the wake of the coronavirus outbreak and the issuance of the state of emergency order, but recovered at a faster pace than expected in the second half due to the resumption of economic activity following the lifting of the state of emergency order. However, with the reissuance of the state of emergency, economic activity remained sluggish from the beginning of 2021.
In the October–December quarter of 2021, we expect a high annual growth rate of 7.3%. Although exports, particularly of automobiles, will be sluggish due to the lingering effects of supply constraints, private consumption is expected to grow at a high rate of 2.5% from the previous quarter because consumption of face-to-face services, such as dining out and travel, will recover following the lifting of the state of emergency. Capital investment, which declined in the July–September quarter, is likely to turn upward in the October–December quarter, as corporate profits continue to improve.
Looking ahead, economic activity will continue to be heavily influenced by the coronavirus outbreak and the corresponding public health measures. Currently, the infection has been very limited in Japan, but the number of people infected with the virus has been rising again in Germany and the Netherlands.
In Japan, there is no denying the possibility that the number of infected people will increase in the future due to the emergence of new variants and changes in temperature, and if action restrictions are tightened as in the past, there is a risk that economic activity will stagnate again, particularly in the consumption of face-to-face services. On the other hand, if sufficient progress is made in the expansion of the medical system and the appropriate allocation of medical resources, even if the number of infected patients increases to a certain extent, the need to restrict economic activities strictly will decrease, and the economy may greatly improve.
The real GDP growth rate is expected to be 2.6% in FY 2021, 2.5% in FY 2022, and 1.7% in FY 2023. Even if restrictions on economic activities are eased, consumer spending will not recover in earnest because a certain level of concern about infectious diseases will curb consumption of face-to-face services. Private consumption saw a sharp decline of 5.8% in FY 2020 and it is expected to increase 2.6% in FY 2021, 2.2% in FY 2022, and 1.3% in FY 2023. On the one hand, the pace of recovery of consumption is quite slow. The level of private consumption on a fiscal year basis will not exceed the latest peak (FY 2018) until FY 2024.

On the other hand, against the backdrop of improvements in corporate profits that have already exceeded pre-coronavirus levels, capital investment, which posted a 6.9% decrease in FY 2020, is expected to increase 1.6% in FY 2021 and maintain a high growth rate of 4.0% in FY 2022 and 3.5% in FY 2023.
 In addition, exports, which have been weakening recently, are on an upward trend again in response to the easing of supply constraints and the recovery of overseas economies. Exports are expected to remain strong, with increases of 11.6% in FY 2021, 4.4% in FY 2022, and 4.0% in FY 2023, thereby boosting the growth rate.
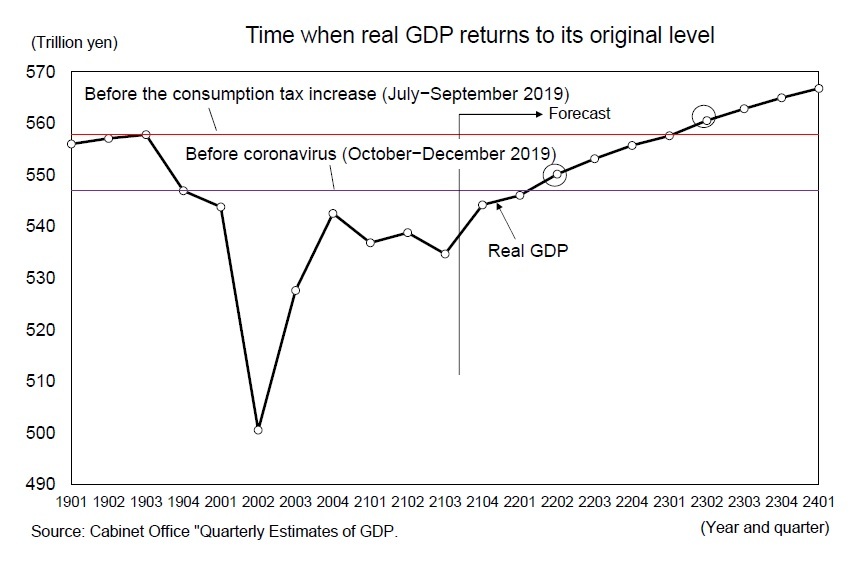
At the moment, we expect real GDP to surpass its pre-coronavirus level (October–December quarter of 2019) in the April–June quarter of 2022 and return to its most recent peak before consumption tax rate hike (July–September 2019) in the April–June quarter of 2023.
(Price Outlook)
Consumer prices (total CPI excluding fresh food) increased by 0.1% year-on-year in September 2021, the first increase in 1 year and 6 months. The sharp decline in mobile phone charges has pushed down the core CPI inflation rate by more than 1%, while rising energy prices due to high oil prices and rising accommodation fees due to the suspension of the Go To Travel campaign have pushed up the core CPI.
Energy prices are expected to go up at a faster pace, particularly in the electricity and gas bills, which reflect the delayed effects of high crude oil prices. Energy prices will rise from 7.4% year-on-year in September 2021 to nearly 20% by the end of 2021, and the contribution to core CPI inflation will expand to the low 1% range from around 0.5% in September 2021. In addition, the growth of food prices (excluding fresh food) is expected to increase further as a trend to pass on increased costs due to higher raw material prices spreads.
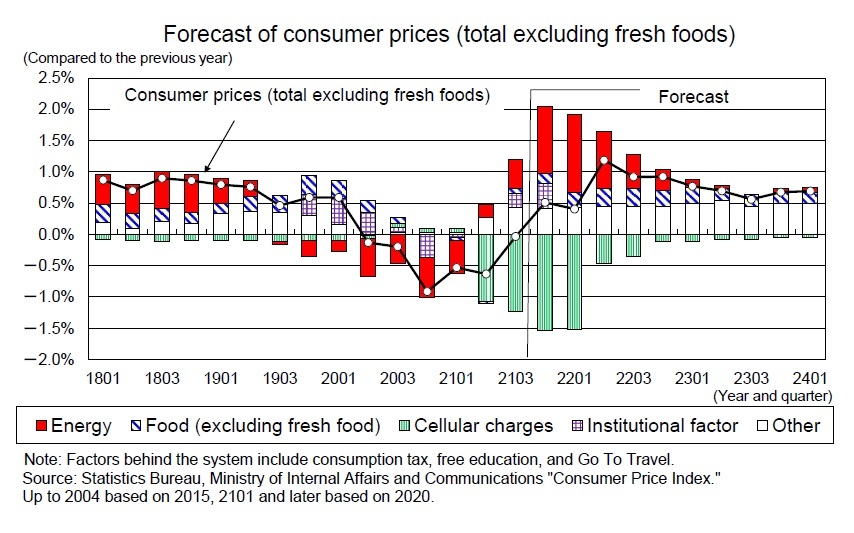 The core CPI is likely to increase to the upper 0% level by the end of 2021, mainly due to the accelerating pace of energy price increases. After January 2022, when the impact of the "Go To Travel" shutdown is expected to dissipate, the growth rate will decline, but after the start of fiscal 2022, when the impact of the sharp decline in mobile phone charges will diminish, the core CPI inflation rate is expected to accelerate to the low 1% range. However, downward pressure from the supply and demand side remains, and stagnant wage growth, which is highly linked to service prices, continues, so it is not expected that price trends will increase significantly.
Core CPI inflation is projected at 0.1% in FY 2021, 0.9% in FY 2022 and 0.7% in FY 2023.
Please note: The data contained in this report has been obtained and processed from various sources, and its accuracy or safety cannot be guaranteed. The purpose of this publication is to provide information, and the opinions and forecasts contained herein do not solicit the conclusion or termination of any contract.
(2021年11月24日「Weekly エコノミスト・レター」)
このレポートの関連カテゴリ

 各種レポート配信をメールでお知らせ。読み逃しを防ぎます!
03-3512-1836
経歴
- ・ 1992年:日本生命保険相互会社
・ 1996年:ニッセイ基礎研究所へ
・ 2019年8月より現職
・ 2010年 拓殖大学非常勤講師(日本経済論)
・ 2012年~ 神奈川大学非常勤講師(日本経済論)
・ 2018年~ 統計委員会専門委員
斎藤 太郎のレポート
| 日付 | タイトル | 執筆者 | 媒体 |
|---|---|---|---|
| 2025/10/31 | 2025年7-9月期の実質GDP~前期比▲0.7%(年率▲2.7%)を予測~ | 斎藤 太郎 | Weekly エコノミスト・レター |
| 2025/10/31 | 鉱工業生産25年9月-7-9月期の生産は2四半期ぶりの減少も、均してみれば横ばいで推移 | 斎藤 太郎 | 経済・金融フラッシュ |
| 2025/10/31 | 雇用関連統計25年9月-女性の正規雇用比率が50%に近づく | 斎藤 太郎 | 経済・金融フラッシュ |
| 2025/10/30 | 潜在成長率は変えられる-日本経済の本当の可能性 | 斎藤 太郎 | 基礎研レポート |


新着記事
-
2025年11月07日
フィリピンGDP(25年7-9月期)~民間消費の鈍化で4.0%成長に減速、電子部品輸出は堅調 -
2025年11月07日
次回の利上げは一体いつか?~日銀金融政策を巡る材料点検 -
2025年11月07日
個人年金の改定についての技術的なアドバイス(欧州)-EIOPAから欧州委員会への回答 -
2025年11月07日
中国の貿易統計(25年10月)~輸出、輸入とも悪化。対米輸出は減少が続く -
2025年11月07日
英国金融政策(11月MPC公表)-2会合連続の据え置きで利下げペースは鈍化
お知らせ
-
2025年07月01日
News Release
-
2025年06月06日
News Release
-
2025年04月02日
News Release
【Japan's Economic Outlook for Fiscal 2021 to 2023】【シンクタンク】ニッセイ基礎研究所は、保険・年金・社会保障、経済・金融・不動産、暮らし・高齢社会、経営・ビジネスなどの各専門領域の研究員を抱え、様々な情報提供を行っています。
Japan's Economic Outlook for Fiscal 2021 to 2023のレポート Topへ- 新型コロナウイルス
- ウィズコロナ・アフターコロナ
- 生成AI・AI
- IoT
- デジタルトランスフォーメーション(DX)
- フィンテック(FinTech)
- キャッシュレス
- デジタル通貨
- デジタルプラットフォーム
- マイナンバー
- MaaS、CASE
- SDGs
- ESG
- 気候変動
- カーボンニュートラル・脱炭素社会
- サステナビリティ
- ウェルビーイング
- 生物多様性
- イデコ(iDeCo)
- 新NISA・NISA
- 日本銀行
- 人手不足・人材不足
- 働き方改革
- 人的資本経営
- 従業員エンゲージメント
- テレワーク・在宅勤務
- ダイバーシティ(多様性)社会
- 外国人雇用・就労
- 労働政策
- 地域包括ケア・地域共生社会
- 認知症
- 金融(ファイナンシャル)ジェロントロジー
- 全世代型社会保障
- 社会保障・税改革
- 医療・介護制度改革
- 健康寿命
- 健康経営
- 格差・貧困
- 世代間格差
- パワーカップル
- 未婚化
- プレコンセプションケア
- 少子高齢化
- 東京一極集中
- インバウンド
- シェアリングエコノミー
- Z世代・α世代
- エンタメ
- オフィスレントインデックス
- 生命保険事業概況
- 米中貿易摩擦
- 米国
- 中国
- 欧州
- アジア・新興国
- 韓国
- ASEAN
- 統計
- 確定拠出年金
- 企業型DC
- 資産所得倍増プラン
- 金融リテラシー
- 住宅リテラシー
- 年金制度改革
- インド
- 経済安全保障
- 供給網(サプライ・チェーン)
- 消費者物価指数(CPI)│日本
- 雇用統計│日本
- 鉱工業生産指数│日本
- 貿易統計│日本
- 法人企業統計│日本
- QE速報・予測
- 日銀金融政策決定会合
- 日銀短観│日本
- 資金循環統計│日本
- 景気ウォッチャー調査│日本
- 地域経済報告(さくらレポート)
- マネタリーベース│日本
- GDP等│米国
- FOMC(連邦公開市場委員会)│米国
- 住宅販売・着工│米国
- 雇用統計│米国
- 米個人所得・支出|米国
- ECB政策理事会│欧州
- ユーロ圏消費者物価指数
- ユーロ圏GDP
- ユーロ圏失業率
- 英国雇用関連統計
- 英国金融政策
- 英国GDP
- 将来人口推計
- 人口動態統計
- 宿泊旅行統計
- 中国GDP
- インドGDP
- タイGDP
- マレーシアGDP
- フィリピンGDP
- インドネシアGDP
- ベトナムGDP
- ロシアGDP
- ブラジルGDP
- IMF世界経済見通し
- 企業物価指数
- インド消費者物価
研究領域
Copyright © NLI Research Institute. All rights reserved.