


- NLI Research Institute >
- Asset management・Asset building >
- Investors Trading Trends in Japanese Stock Market:An Analysis for December 2024
Column
15/01/2025
Investors Trading Trends in Japanese Stock Market:An Analysis for December 2024
Financial Research Department Chizuru Morishita


Font size
- S
- M
- L
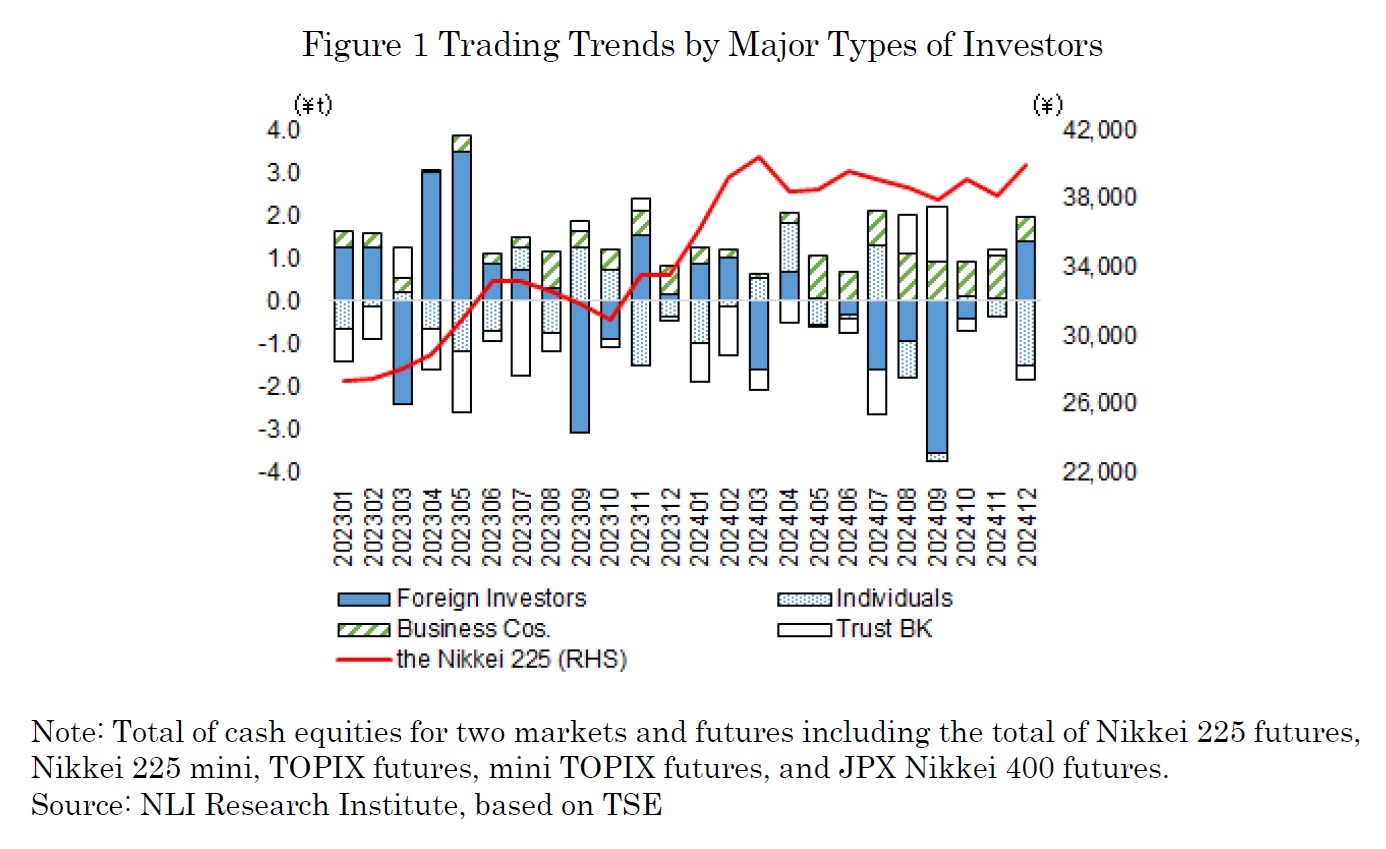
In December 2024, the Nikkei Stock Average initially rose to 39,248 on the 3rd, buoyed by the strength in U.S. high-tech stocks. The index remained steady above the 39,000 mark during the early part of the month. In mid-December, the U.S. Federal Open Market Committee (FOMC) revised its 2025 rate cut outlook from four to two times on the 18th, which weighed on U.S. stocks. Consequently, the Nikkei slipped below 39,000 on the 19th and declined further to 38,701 on the 20th. Towards the end of the month, the yen weakened further following dovish remarks by Bank of Japan Governor Kazuo Ueda. Additionally, auto stocks supported the index, driven by positive news regarding shareholder returns and ROE targets. As a result, the Nikkei climbed to 40,281 on the 27th. At the month-end, profit-taking ahead of the year-end and New Year holidays caused the index to soften, finishing at 39,894. Amid these fluctuations, foreign investors and business corporations were net buyers, while individuals and trust banks were net sellers (as shown in Figure 1).

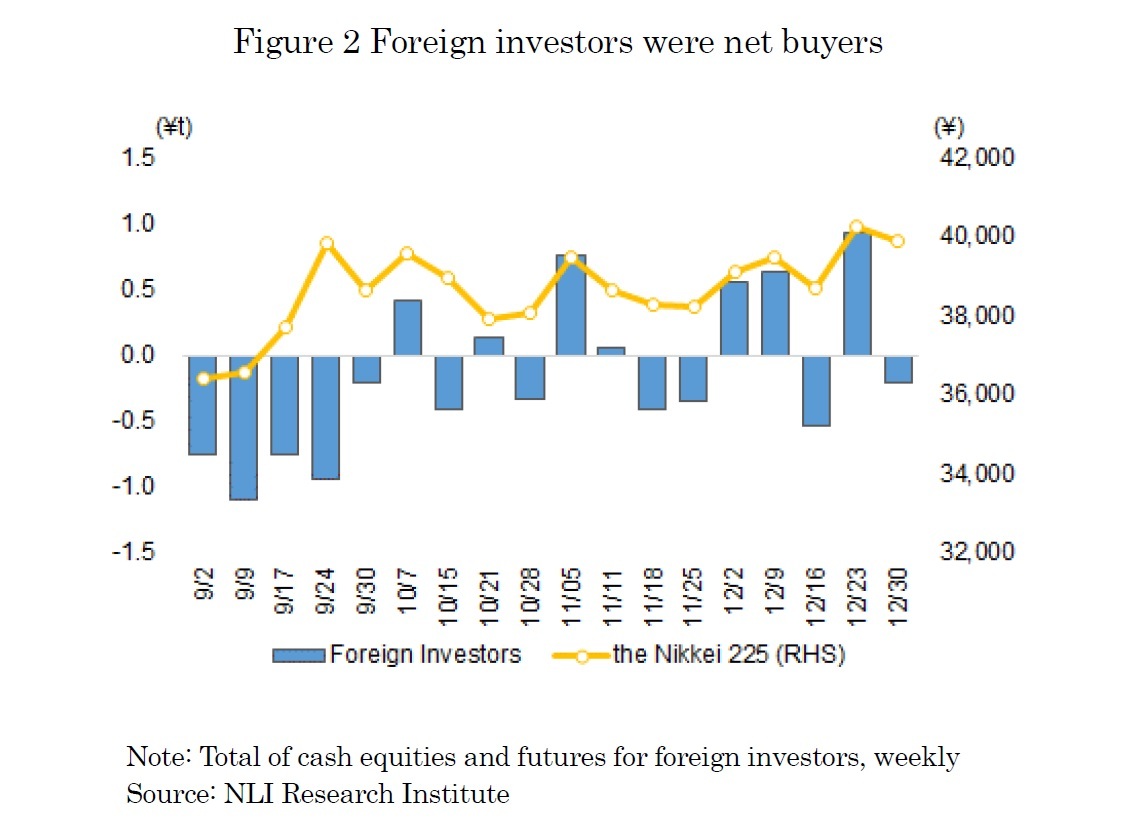
The trading by type of investors in December 2024 (December 2 to 30) shows that foreign investors were the largest net buyers, with a total net purchase of 1.372 trillion yen in cash equities and futures (as shown in Figure 2).

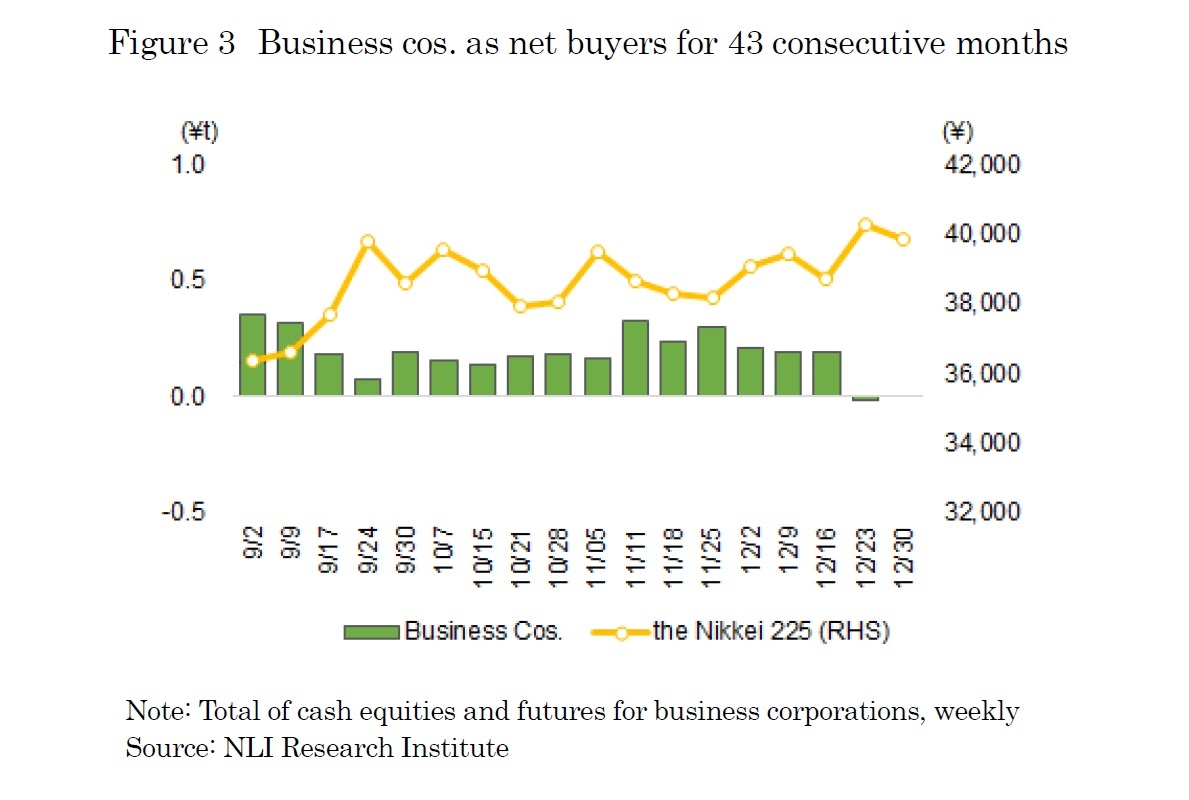
In December, business corporations were also net buyers for the 43rd consecutive month, with a total net purchase of 579.8 billion yen in cash equities and futures (as shown in Figure 3).

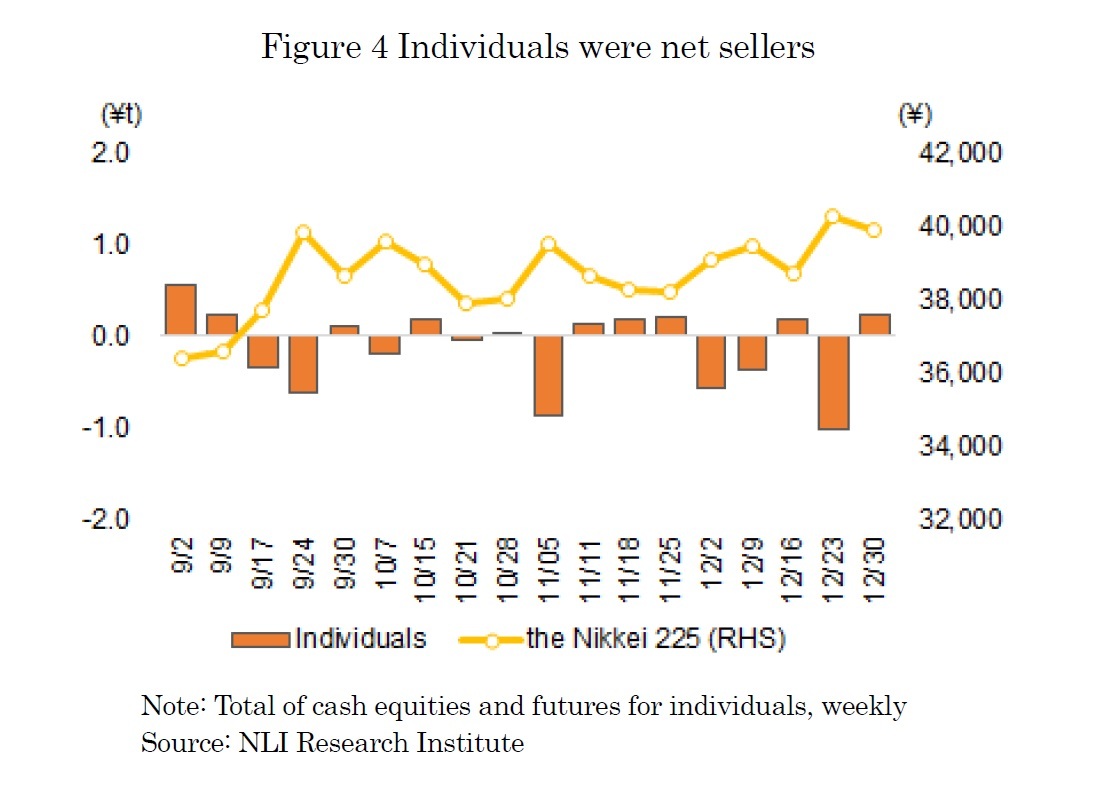
On the other hand, individuals were the largest net sellers in December, with a total net sale of 1.513 trillion yen in cash equities and futures (as shown in Figure 4). Their investment behavior was characterized by a "contrarian approach," buying when stock prices fell and selling when they rose. Notably, during the fourth week (December 23 to 27), individuals recorded a significant net sale of 1.005 trillion yen. Although it is believed that some buying through the expanded NISA program had already begun as the new fiscal year effectively started on December 27 2024, profit-taking sales appeared to dominate as the Nikkei exceeded the 40,000 mark. However, in the fifth week (December 30), as selling pressure dominated the market ahead of the New Year holidays—leading to a roughly 380-yen decline in the Nikkei —individuals showed a net buying stance.

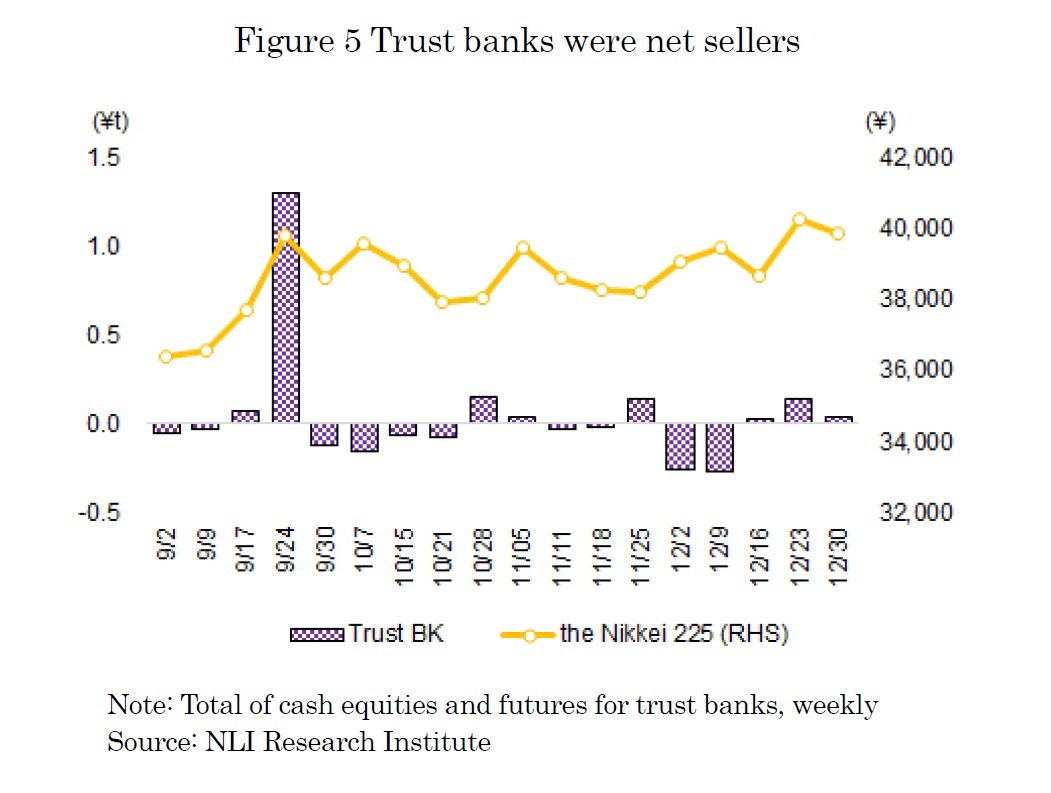
In December, trust banks were also net sellers, with a total net sale of 357 billion yen in cash equities and futures (as shown in Figure 5).

So, what were the characteristics of the trading trends by type of investors throughout 2024? The primary net buying group in 2024 was business corporations, with a total net purchase of 7.87 trillion yen. On the other hand, the main net selling groups were foreign investors (▲4.41 trillion yen), trust banks (▲2.74 trillion yen), and individuals (▲1.62 trillion yen) (as shown in Figure 6). It can be observed that the net buying by business corporations supported the net selling by foreign investors, trust banks, and individuals.
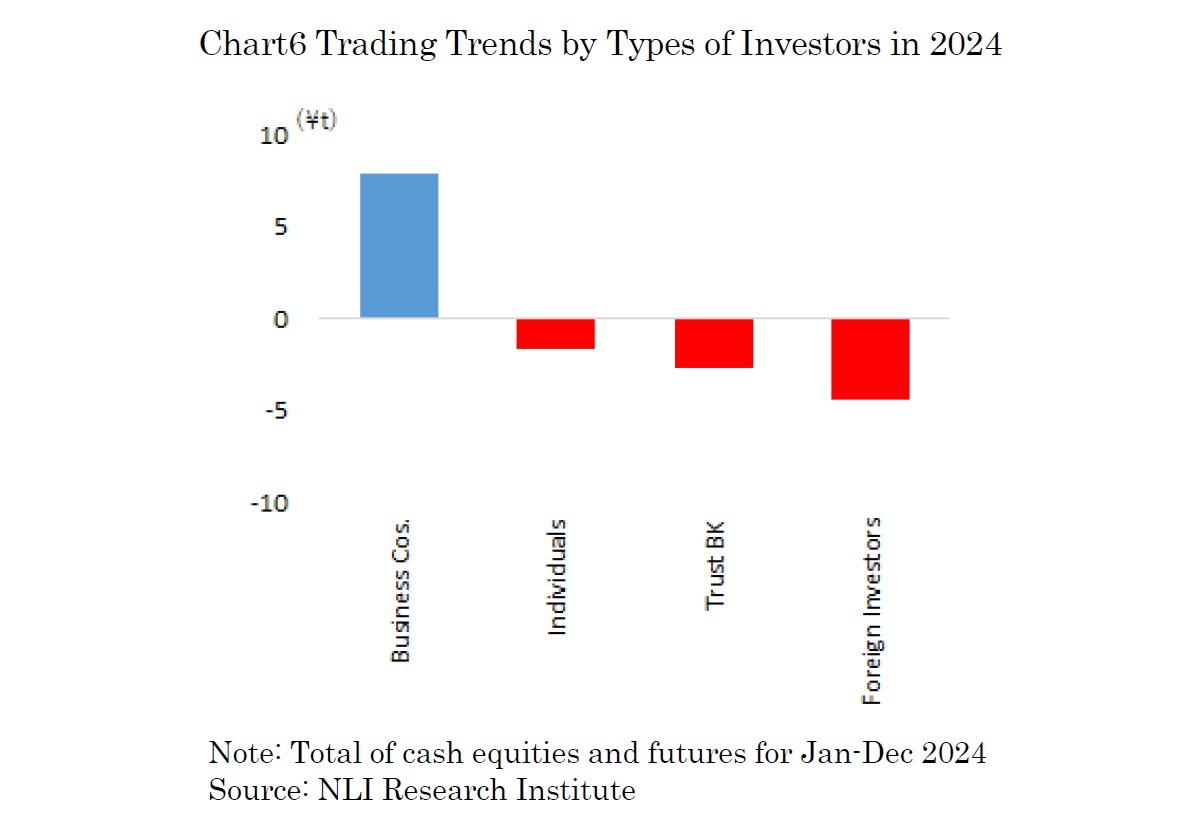

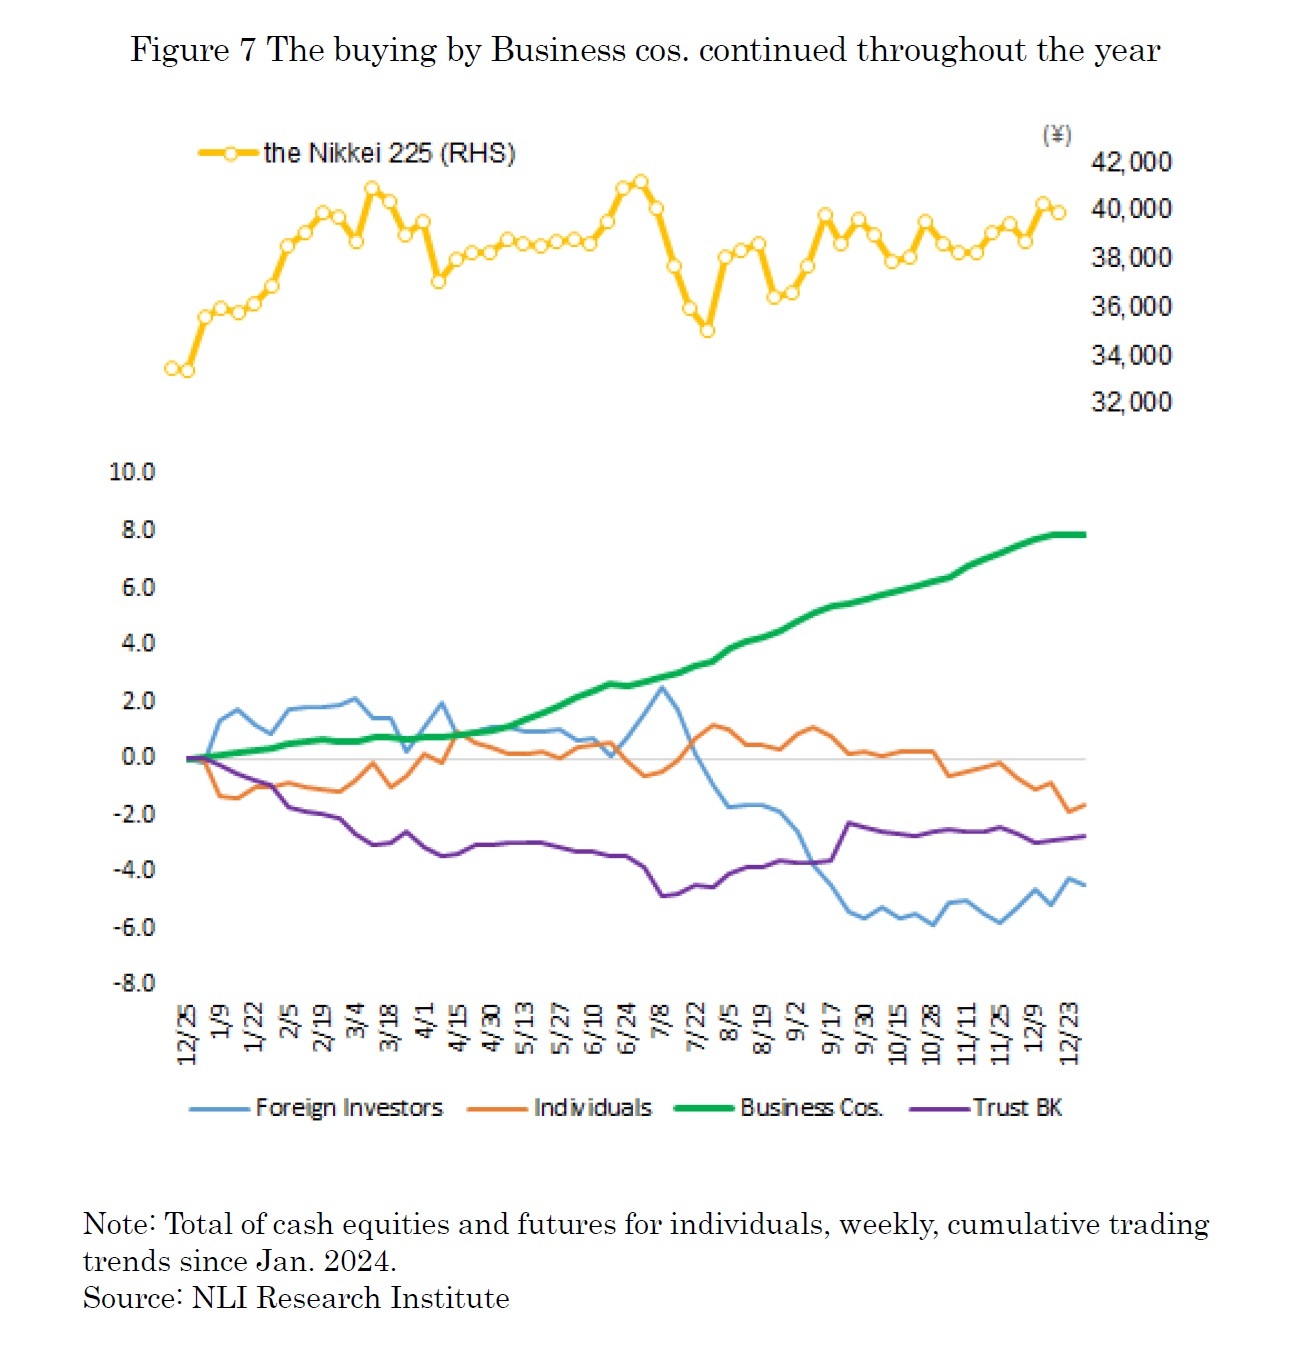
Figure 7 shows the cumulative weekly trading trends in cash equities and futures by type of investors in 2024. Foreign investors were net buyers during the first half of 2024, but selling dominated from June onward, resulting in five consecutive months of net selling through October. Notably, during the three months from July to September, foreign investors recorded a significant net sale of approximately 6 trillion yen. In July, the Bank of Japan decided to raise the policy interest rate by 0.25%, and in early August, concerns over a U.S. recession surged rapidly following the release of U.S. economic indicators. This triggered a risk-averse move, leading to accelerated selling of Japanese stocks by foreign investors. Although this rapid risk-off sentiment temporarily subsided, foreign investors continued selling, likely due to uncertainty surrounding the direction of monetary policy in Japan and the U.S., as well as domestic political events in Japan, including the Liberal Democratic Party's leadership election in September and the general election for Japan’s House of Representatives in October.
On the other hand, business corporations, reflecting corporate share buybacks, were net buyers throughout the year. The total amount of share buyback programs announced by listed companies (TOPIX constituents) in 2024 reached 17 trillion yen. On a weekly basis, business corporations were net sellers in only five of the 53 weeks in 2024. Efforts to improve capital efficiency and shareholder returns have continued, and the net buying by business corporations, driven by share buybacks, is expected to persist moving forward.

On the other hand, business corporations, reflecting corporate share buybacks, were net buyers throughout the year. The total amount of share buyback programs announced by listed companies (TOPIX constituents) in 2024 reached 17 trillion yen. On a weekly basis, business corporations were net sellers in only five of the 53 weeks in 2024. Efforts to improve capital efficiency and shareholder returns have continued, and the net buying by business corporations, driven by share buybacks, is expected to persist moving forward.
Please note: This report includes data from various sources and NLI Research Institute does not guarantee the accuracy and reliability. In addition, this report is intended only for providing information, and the opinions and forecasts are not intended to make or break any contracts.

03-3512-1855
レポート紹介
-
研究領域
-
経済
-
金融・為替
-
資産運用・資産形成
-
年金
-
社会保障制度
-
保険
-
不動産
-
経営・ビジネス
-
暮らし
-
ジェロントロジー(高齢社会総合研究)
-
医療・介護・健康・ヘルスケア
-
政策提言
-
-
注目テーマ・キーワード
-
統計・指標・重要イベント
-
媒体
- アクセスランキング
Copyright © 2016 NLI Research Institute. All rights reserved.