


- NLI Research Institute >
- Economics >
- Japan’s Economic Outlook for Fiscal Years 2023 to 2025 (February 2024)
16/02/2024
Japan’s Economic Outlook for Fiscal Years 2023 to 2025 (February 2024)


Font size
- S
- M
- L
1.Annualized negative growth in the October–December quarter of 2023
The real GDP for the October–December quarter of 2023 decreased by ˗0.1% compared to the previous quarter (˗0.4%) on an annualized basis, representing the second consecutive quarterly decline. This negative growth was mainly due to the decline in demand from the domestic private sector. Decreases were observed in private consumption (˗0.2% from the previous quarter), housing investment (˗1.0% from the previous quarter), and capital investment (˗0.1% from the previous quarter). By contrast, foreign demand boosted the growth rate by 0.2% compared to the previous quarter. The substantial growth in the exports of goods and services (2.6% from the previous quarter) was mainly due to the growth in the latter, which exceeded the imports of goods and services (1.7% from the previous quarter). Nevertheless, this was insufficient to offset the decline in domestic demand.
Nominal GDP increased for the first time in two quarters to 0.3% from the previous quarter 1.2% on an annualized basis), outpacing real growth. On the other hand, the GDP deflator increased by 0.4% from the previous quarter (against 0.8% in the July–September quarter) and 3.8% year-on-year (against 5.2% in the July–September quarter). In addition to the rise in the prices of goods, the prices of services also increased because of the higher labor costs, boosting the domestic demand deflator for the 12th consecutive quarter (0.4% from the previous July–September quarter).
As a result, the real GDP in the calendar year 2023 was 1.9% (against 1.0% in 2022) and the nominal GDP was 5.7% (against 1.3% in 2022), and both show positive growth for the third consecutive year. The nominal GDP exhibited the highest growth in 32 years (since 1991, 6.5%).
As a result, the real GDP in the calendar year 2023 was 1.9% (against 1.0% in 2022) and the nominal GDP was 5.7% (against 1.3% in 2022), and both show positive growth for the third consecutive year. The nominal GDP exhibited the highest growth in 32 years (since 1991, 6.5%).
(Exports are not expected to drive the economy)
Although the global economy has maintained a certain degree of resilience, with the growth rate hovering around 3% (according to the Institute’s estimate), the global trade volume has continued to decline since the October–December quarter of 2022. Even though the non-manufacturing sector has tended to recover, partly because of pent-up demand in the post-COVID-19 period, global trade has experienced a decline because of continued stagnation in the manufacturing sector resulting from IT-related inventory adjustments and other factors.
Although the global economy has maintained a certain degree of resilience, with the growth rate hovering around 3% (according to the Institute’s estimate), the global trade volume has continued to decline since the October–December quarter of 2022. Even though the non-manufacturing sector has tended to recover, partly because of pent-up demand in the post-COVID-19 period, global trade has experienced a decline because of continued stagnation in the manufacturing sector resulting from IT-related inventory adjustments and other factors.
The real GDP growth in the United States continues to exceed expectations, reaching an annualized 4.9% from the previous quarter in the July–September quarter of 2023 and an annualized 3.3% from the previous quarter in the October–December quarter of 2023. However, growth is expected to slow down by mid-2024 to an annualized 1% as a result of cumulative monetary tightening. The real GDP growth in the euro area is likely to remain low in 2024 (0.7%, following 0.5% in 2023). Furthermore, China’s real GDP growth rate in 2023, which rose to 5.2%from 3.0% in 2022 after the end of the zero-COVID-19 policy, is expected to decline to about 4% in 2024 and 2025 because of the prolonged slump in the real estate market and other factors.
Therefore, the growth of the overseas economy slowed down significantly from about 6% in 2021 to 3% in 2022 and 2023 and is expected to remain around 3% in 2024 and 2025, which is below the average growth rate of approximately 4% seen since 1980.
After slowing down from 4.7% y/y in FY2022 to 4.2% y/y in FY2023, Japan’s exports are expected to decrease below 3% y/y in both FY2024 and FY2025, partly because of the strong yen. Thus, exports are not expected to drive the Japanese economy in the foreseeable future.
(Revenge consumption is subdued)
Personal consumption, which rapidly declined due to the impact of the COVID-19 pandemic, was expected to recover quickly as COVID-19 subsided and socioeconomic activities normalized. However, a sudden expansion of consumption—the so-called “revenge consumption”—has not materialized. In May 2023, COVID-19 was reclassified as a Class 5 disease under the Infectious Disease Control Law. However, private consumption as part of the GDP has declined for three consecutive quarters since the April–June quarter of 2023 and shows increasing signs of stagnation.
The negative effect of high prices partly explains the sluggish consumption despite the normalization of socioeconomic activities. Nonetheless, price increases exceeding 2% y/y began in April 2022 and personal consumption remained relatively firm during FY2022. This was probably due to the significant decline in consumption levels that resulted from the restrictions on activities in the wake of the COVID-19 pandemic, as well as various support measures such as the provision of special fixed benefits, which led to a high household savings rate.
The household savings rate averaged 1.2% from 2015 to 2019 (before the pandemic) but jumped to 21.1% in the April–June quarter of 2020 as a result of the sharp drop in consumption following the declaration of a state of emergency in April 2020 as well as the substantial increase in disposable income because of the provision of special fixed benefits. Subsequently, the savings rate declined as consumption rose as a result of the easing of COVID-19 restrictions. The high prices also played a role in this. Nonetheless, the savings rate remained higher than before the pandemic until 2022. Thus, despite the headwind of high prices, private consumption remained strong by lowering the savings rate.
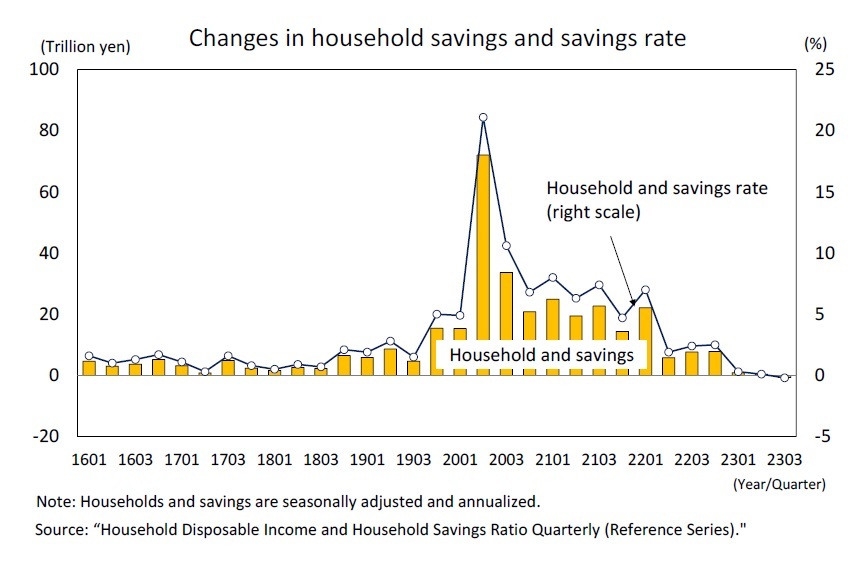 However, the “Preliminary Quarterly Report on Household Disposable Income and Household Savings Ratio (Reference Series)” released by the Cabinet Office in January 2024 revealed that the household savings rate declined significantly after the start of 2023, turning slightly negative (˗0.2%) in the July–September quarter of 2023. Thus, the consumption-boosting effect of the decrease in the savings rate has already disappeared.
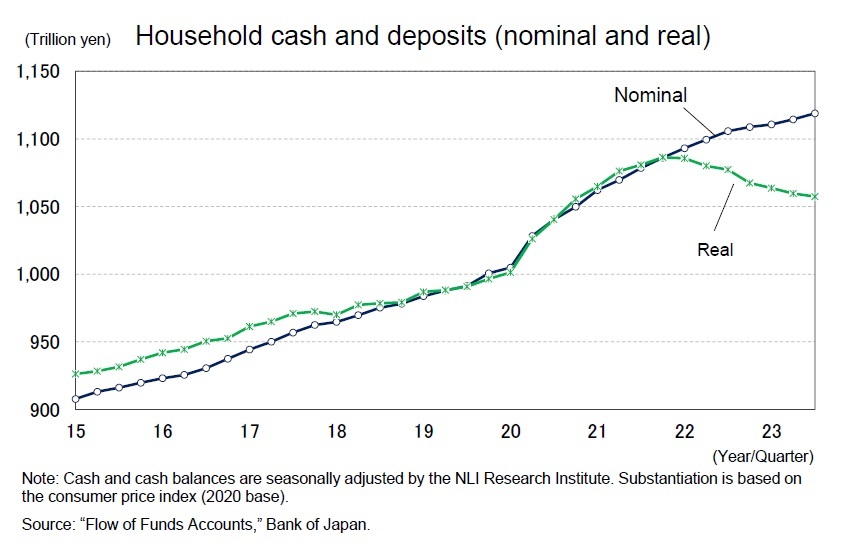 Furthermore, flow-based savings are already below pre-COVID-19 levels. Therefore, although revenge consumption through a decrease in the saving rate is not expected to continue, households should have ample accumulated savings from the time of the pandemic. Accordingly, as a result of the accumulation of flow savings, households’ cash and deposit balances as stock are increasing at an accelerated pace in response to the increase in savings during the pandemic.
However, when household cash and deposit balances are realized by the 2020-based consumer price index, it is evident that they increased significantly during the COVID-19 pandemic but have been in decline since 2022. Therefore, high prices led to a decrease not only in income (flow) but also in financial assets (stock) accumulated during the pandemic and resulted in a lack of revenge consumption.
(The spring wage offensive of 2024 is expected to result in a 4.0% wage increase)
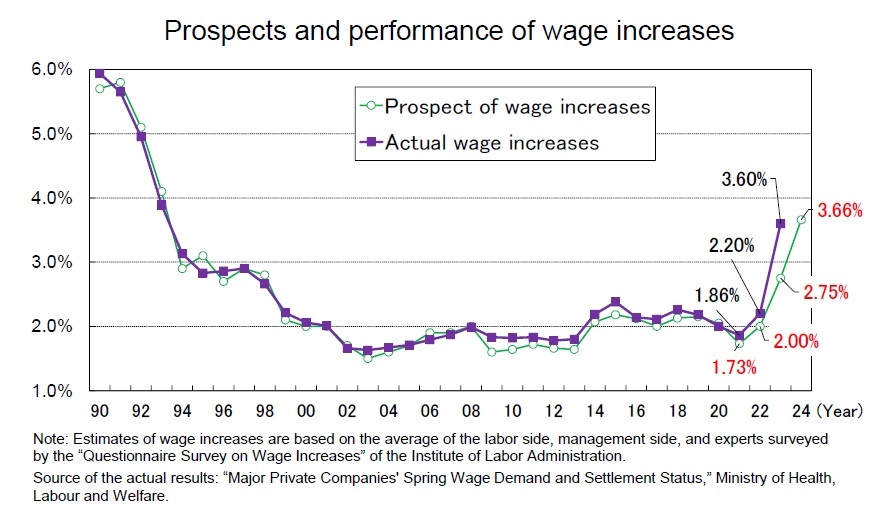
The spring wage offensive of 2023 resulted in a 3.60% wage increase—the highest in 30 years—according to the “Status of Spring Wage Hike Demands and Compromises by Major Private Corporations” of the Ministry of Health, Labour and Welfare. Meanwhile, the unemployment rate has remained in the mid-2% range, and the labor supply-demand balance remains tight. Moreover, ordinary profit (seasonally adjusted) in the corporate sector is at record high levels, and consumer price inflation has remained high. Thus, the environment for wage increases remains favorable.
The spring wage offensive of 2023 resulted in a 3.60% wage increase—the highest in 30 years—according to the “Status of Spring Wage Hike Demands and Compromises by Major Private Corporations” of the Ministry of Health, Labour and Welfare. Meanwhile, the unemployment rate has remained in the mid-2% range, and the labor supply-demand balance remains tight. Moreover, ordinary profit (seasonally adjusted) in the corporate sector is at record high levels, and consumer price inflation has remained high. Thus, the environment for wage increases remains favorable.
 In the 2023 spring wage offensive, RENGO raised its demands for a rise from around 4% (including the portion equivalent to regular salary increases)—which dates back to 2015——to approximately 5%. Also, RENGO will demand a rise of 5% or more in the 2024 spring wage offensive. Furthermore, RENGO member unions are increasingly proposing high wage hikes. In addition, management shows a positive attitude toward wage increases, as evidenced by Keidanren’s “2024 Report of the Special Committee on Management and Labor Policy,” which states that contributing to the realization of structural wage increases is a “social responsibility.”
According to the “Questionnaire Survey on Wage Increases,” released on January 31st by the Institute for the Study of Labor Administration, forecasts for 2024 indicate an average wage increase of 3.66% according to approximately 478 labor and management parties and experts in the labor economy. This is significantly higher than the previous year’s forecast (2.75%) and slightly higher than the actual result for 2023 (3.60%). Actual wage increases by major companies compiled by the Ministry of Health, Labour and Welfare tend to be slightly higher than those forecasted by the same survey, but the actual increase for 2023 was significantly higher. Taking these factors into account, the current forecast is for a 4.00% increase in the spring wage offensive of 2024.
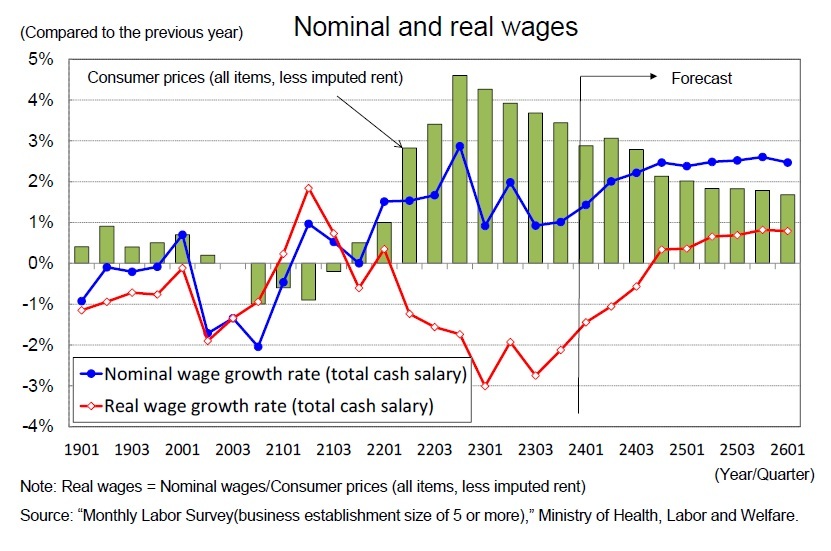
Real wages have been negative since April 2022, mainly due to consumer price inflation. Although nominal wage growth is expected in the future, the decline in real wages is likely to continue for some time because consumer price inflation will remain high. Thus, real wage growth is not expected to turn positive until the second half of FY2024, when consumer price inflation is expected to fall below 2%.
 In FY2022, nominal employee compensation increased for the second consecutive year (2.4% , but real employee compensation decreased (˗1.3% ) because of the increase in consumer prices. As a result, real employee compensation is expected to decline for the second consecutive year, to ˗1.5%. On the other hand, nominal employee compensation is expected to rise to 2.7% in FY2024 and 2.9% in FY2025 because of the wage increases resulting from the spring wage offensive. In addition, price hikes are expected to slow down. Therefore, real employee compensation is expected to increase to 0.4% y/y in FY2024, for the first time in three years, and then rise to 1.4% y/y in FY2025. At the same time, price increases are expected to slow down.
レポート紹介
-
研究領域
-
経済
-
金融・為替
-
資産運用・資産形成
-
年金
-
社会保障制度
-
保険
-
不動産
-
経営・ビジネス
-
暮らし
-
ジェロントロジー(高齢社会総合研究)
-
医療・介護・健康・ヘルスケア
-
政策提言
-
-
注目テーマ・キーワード
-
統計・指標・重要イベント
-
媒体
- アクセスランキング
Copyright © 2016 NLI Research Institute. All rights reserved.