


- NLI Research Institute >
- Economics >
- Japan's Productivity through the Lens of “Cheap Japan”
13/04/2023
Japan's Productivity through the Lens of “Cheap Japan”


Font size
- S
- M
- L
I. Introduction
Historically, Japan was recognized as an expensive country, and the issue of the domestic–foreign price gap was subject to extensive discussion. However, in recent years, Japan has earned the reputation of “cheap Japan”, with prices no longer consistently ranking high among developed nations. It is often pointed out that the relative lack of productivity growth and the decline in innovation in Japan may be contributing to this trend1. This paper aims to empirically examine higher or lower price levels in Japan relative to foreign countries. Based on this analysis, this work systematically investigates the structural factors behind the “cheap Japan” phenomenon by exploring the relationship between the real exchange rate—reflecting the disparity between domestic and foreign prices—and productivity, utilizing the Balassa–Samuelson hypothesis.
1 For example, Ito (2022) contends that the sluggish growth of Japanese productivity, particularly in the tradable industry, serves as the fundamental factor behind the “cheap Japan” phenomenon. Conversely, Watanabe (2022) explores U.S.-Japan relations and attributes the occurrence of the “cheap Japan” phenomenon to the yen's depreciation exceeding purchasing power parity and the discrepancy wherein real wages in the U.S. are increasing while those in Japan are not.
1 For example, Ito (2022) contends that the sluggish growth of Japanese productivity, particularly in the tradable industry, serves as the fundamental factor behind the “cheap Japan” phenomenon. Conversely, Watanabe (2022) explores U.S.-Japan relations and attributes the occurrence of the “cheap Japan” phenomenon to the yen's depreciation exceeding purchasing power parity and the discrepancy wherein real wages in the U.S. are increasing while those in Japan are not.
II. Current Status of “Cheap Japan”
1. Comparison by Big Mac Index
Japan is often characterized as a “cheap country”, but the extent prices are truly lower in Japan requires examination. Furthermore, Japan has been historically known as an expensive country, but exactly how expensive was it? Directly comparing prices in Japan with other countries proves challenging as the goods and services offered in Japan are not necessarily identical to those in other countries. Even if price comparisons were attempted, achieving meaningful results would require equivalence in the quality of brands and products. Hence, to initiate our analysis, we turn to the prices of Big Macs sold globally by the McDonald's Corporation.
Based on The Economist magazine's survey of Big Mac prices (Big Mac Index) as of January 2023, the selling price in Japan was ¥4102 (equivalent to US$3.15), $5.36 in the U.S., and €4.86 (equivalent to US$5.28) in the eurozone.
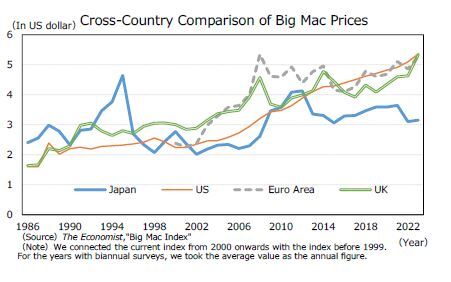 The theory positing that exchange rates are established to equalize price levels at home and abroad is known as the purchasing power parity (PPP) hypothesis, with the nominal exchange rate at the time referred to as the PPP rate. Calculating the PPP rate using the price of a Big Mac, given that the Big Mac is sold for \410 in Japan and $5.36 in the U.S., the PPP rate in yen-dollar amounts to \410 = $5.36, or \76.49 per dollar. However, the actual nominal (market) exchange rate at the time of the survey stood at \130.10 per dollar, representing a significant disparity. At least in terms of the Big Mac's price, the PPP hypothesis does not hold true.
An indicator of the difference between domestic and foreign prices is the real exchange rate, which is the ratio of the domestic to the foreign price converted at the market exchange rate. While the nominal exchange rate indicates the ratio of exchange (relative prices) between domestic and foreign currencies, the real exchange rate indicates the ratio of exchange (relative prices) between domestic and foreign goods and services. If the PPP hypothesis holds, the real exchange rate is 1 (times).
The real exchange rate, as measured by the price of a Big Mac, is the ratio of the selling price in Japan (\410) converted to U.S. dollars at the market exchange rate (130.10 ¥/$) ($3.15) to the selling price in the United States ($5.36), which is 0.59 (times). This indicates that the price of a Big Mac in Japan is about 60% of the U.S. price, that is, a situation where the price is about 40% lower than in the United States.
The same calculation for the euro shows that the PPP rate for yen-euro is \84.36 per euro, which is 0.6 (times) the real exchange rate.3 The United States was the sixth most expensive country, and the eurozone was the eighth most expensive country. Japan, on the other hand, ranked 42nd from the top, making it the 14th cheapest country to buy a Big Mac.
However, this was not always the case for Japan. For example, in April 2000, the selling price of a Big Mac in Japan was ¥294 (US$ equivalent: $2.77), which was higher than in the United States ($2.24) and the euro area (€2.56, US$ equivalent: $2.38). The PPP rate at that time was 131.25 ¥/$ and 114.84 ¥/€, respectively, meaning that the real exchange rate was 1.24 times that of the United States and 1.16 times the eurozone rate. That is, the Big Mac was about 20% more expensive in Japan than in the United States or the euro area. In April 2000, prices were surveyed in 28 countries, and Japan ranked fifth as the most expensive country for the Big Mac (compared with the euro area, ranked 10th, and the United States, ranked 12th).
 The Big Mac is sold with the same quality worldwide. However, Big Macs are sold at different prices around the world. Of course, it would be difficult to standardize prices in every country at the market exchange rate considering the daily fluctuations in exchange rates and the associated costs of frequent price revisions. Nevertheless, in the long run, such a significant price gap between countries seems unlikely. In fact, prices in Japan have remained relatively cheap for at least the last 10 years. It should be noted, however, that during the period of yen depreciation since the early 2000s, the price of Big Macs in Japan was cheaper than in the United States and Europe (real exchange rate depreciation), just as it is now. On the other hand, during the period of yen appreciation around 2010, the price was higher than in the United Kingdom and United States (real exchange rate appreciation). Nevertheless, in the long run, the trend suggests a depreciation of the real exchange rate.
2 On January 16, 2023, the price increased to 450 yen.
3 The eurozone is treated as a single entity or country.
2. Comparison of Total Prices Using OECD Purchasing Power Parity (PPP) Exchange Rates
The Big Mac is only one product, and the difference in domestic and foreign prices indicated by the real exchange rate calculated for the Big Mac may differ significantly from the overall price differences for a wide range of goods and services.
The Big Mac is only one product, and the difference in domestic and foreign prices indicated by the real exchange rate calculated for the Big Mac may differ significantly from the overall price differences for a wide range of goods and services.
 However, comparing overall prices using price indices is not a straightforward task. Price indices, such as the Consumer Price Index (CPI) and the Producer Price Index (PPI), represent the price level at each specific point in time, with the price level at a particular reference point set at 100. Additionally, the items consumed in each country and their proportions may vary, making direct comparisons challenging. As a result, when calculating the PPP rate or real exchange rate using these price indices, the rate of change is typically used, but it can be influenced by the choice of the base year.
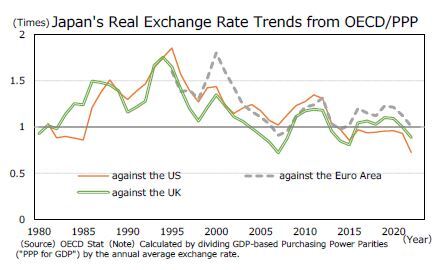
In the following analysis, we utilize the PPP rate calculated by the OECD based on a survey of approximately 3,000 goods and services4 to examine the trend of Japan's real exchange rate. It's important to note that the PPP rate represents the nominal exchange rate that equalizes the price level of the home country with other countries, and the real exchange rate reflects the ratio of the home country's price level to that of other countries, converted at the market exchange rate. Consequently, the real exchange rate is determined by dividing the PPP rate by the market exchange rate. Referring back to the previous example of the Big Mac price comparison between Japan and the U.S., the PPP rate in January 2023 would be 76.49 ¥/$, and the market exchange rate would be \130.10, resulting in a real exchange rate of 0.59 (calculated as 76.49/130.10), which aligns with our earlier calculation.
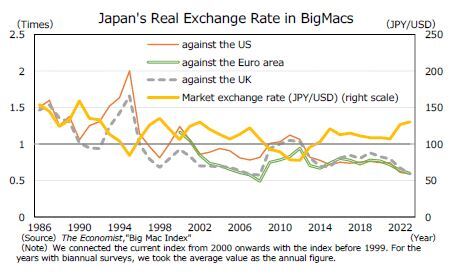
Using this relationship, we computed Japan's real exchange rate from the OECD PPP rate and observed that Japan's price level, which was 1.85 times that of the United States in 1995, declined to 0.72 times that of the United States in 2022, albeit with fluctuations along the way.5
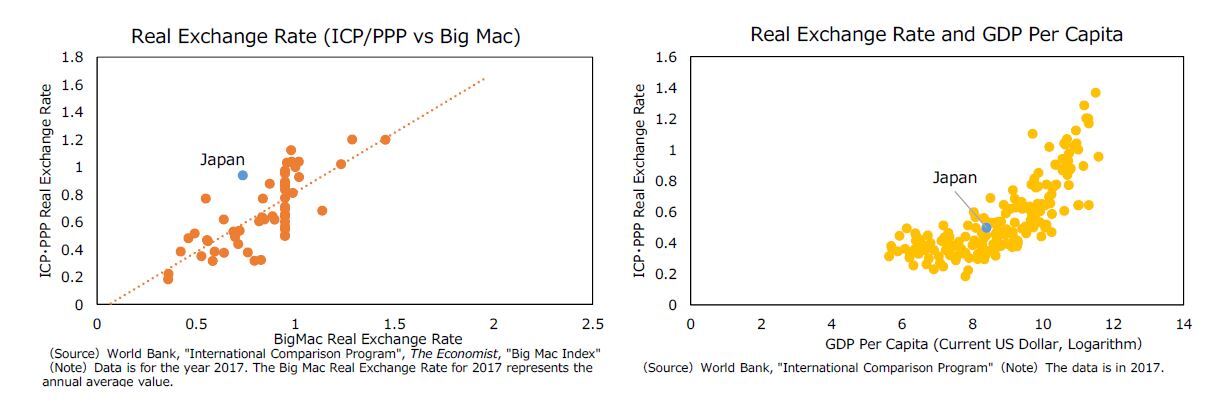
This trend is consistent with the movement of the real exchange rate as measured by the Big Mac. In fact, on a global scale, there is a positive correlation between the difference in domestic and foreign prices of Big Macs and the real exchange rate, as is confirmed by an analysis based on the 2017 results of the International Comparison Program (ICP), in which the OECD also participates, and which calculates the PPP rate for the world as a whole.
Furthermore, in general, the more a country's GDP per capita increases due to economic development, the more the real exchange rate tends to appreciate, meaning prices become relatively more expensive. However, in Japan, the real exchange rate has shown a tendency to depreciate, that is, prices have become cheaper relative to other countries since the late 1990s, both in terms of the price of a Big Mac and overall prices averaged over the period. The underlying factors for this trend warrant further investigation.

4 The OECD conducts comprehensive price surveys encompassing approximately 3,000 goods and services. Utilizing this extensive dataset, the organization publishes PPP (purchasing power parity) rates triennially. For years other than the publication year, PPP rates are derived through supplementary calculations using price deflators.
5 Since approximately 2010, there has been a discernible trend of real exchange rate depreciation against the United States, evident not only in the euro area and the United Kingdom but also in countries with relatively high price levels, such as Switzerland and Norway. This observation implies a relative increase in price levels in the United States.
III. The Relationship Between the Real Exchange Rate and Productivity: The Balassa-Samuelson Hypothesis
1|Balassa-Samuelson Hypothesis
In this section, we delve into the relationship between the real exchange rate and productivity through the Balassa–Samuelson hypothesis, aiming to analyze the factors contributing to the long-term depreciation of Japan's real exchange rate.
In general, goods and services can be categorized into tradable goods (tradables), those that can be exchanged with foreign countries, and non-traded goods (nontradables), those that cannot. It is reasonable to assume that certain services, like haircuts, are nontradables since people are unlikely to travel abroad solely for cheaper haircuts.6 General prices, therefore, comprise both prices of tradables and nontradables.
Tradables are subject to foreign trade; therefore, their prices are influenced by competitive forces.7 Consequently, the real exchange rate is determined by the disparity between domestic and foreign prices of nontradables. That is, in a bilateral comparison, the greater the increase in the price of nontradables relative to tradables in a country, the more the real exchange rate appreciates.
The real exchange rate can be expressed in a formula8 : 𝐸 = 𝑆𝑃/𝑃∗ , where 𝐸 denotes the real exchange rate, 𝑆 represents the nominal exchange rate (market rate), 𝑃 indicates the price level in the home country, and 𝑃∗ represents the price level in other countries. Prices can then be further expressed in terms of tradables and nontradables as 𝑃 = 𝑃𝑇 1−𝜔𝑃𝑁 𝜔, where 𝑃𝑇 denotes the prices of tradables, 𝑃𝑁 denotes the prices of nontradables, 𝜔 symbolizes the weight of nontradables in the home country, and 𝜔∗ signifies the weight of nontradables in the foreign country. Then, 𝐸 = 𝑆𝑃𝑇 1−𝜔𝑃𝑁 𝜔/(𝑃𝑇 ∗1−𝜔∗ 𝑃𝑁 ∗𝜔∗ ). By transforming this formula into logarithms and organizing it, we obtain the following expression: 𝑒 = (𝑠 + 𝑝𝑇 − 𝑝𝑇 ∗ ) + 𝜔(𝑝𝑁 − 𝑝𝑇 ) − 𝜔∗(𝑝𝑁 ∗ − 𝑝𝑇 ∗ ), assuming the law of one price for tradeables, i.e, 𝑠 + 𝑝𝑇 − 𝑝𝑇 ∗ = 0 , the real exchange rate can be simplified as 𝑒 = 𝜔(𝑝𝑁 − 𝑝𝑇 ) − 𝜔∗(𝑝𝑁 ∗ − 𝑝𝑇 ∗ ), representing the ratio of the relative prices of tradables and nontradables .
Furthermore, we explore the relationship between the real exchange rate and productivity. Assuming that the productivity is equally determined by real wages, 𝐴𝑇 = 𝑊/𝑃𝑇 , indicating the productivity of tradables where 𝑊 denotes the nominal wages and 𝐴𝑁 = 𝑊/𝑃𝑁, which represents the productivity of nontradables. If we substitute the logarithms of both equations, 𝑝𝑇 = w − 𝑎𝑇 and 𝑝𝑁 = w − 𝑎𝑁 , into the above expression for the real exchange rate, we derive 𝑒 = 𝜔(𝑎𝑇 − 𝑎𝑁) − 𝜔∗(𝑎𝑇 ∗ − 𝑎𝑁 ∗ ), signifying that the real exchange rate reflects the difference in the productivity ratio of tradables and nontradables between two countries. Consequently, the real exchange rate appreciates more in a country where the productivity of tradables increases more than that of nontradables.
This hypothesis, known as the Balassa–Samuelson hypothesis, posits that the real exchange rate is determined by reflecting bilateral differences in the productivity of tradables and nontradables. Its mechanism can be illustrated with an example:9 Let us consider a scenario where the productivity increases in an industry producing tradables in the home country. This increase in the productivity could result in a decline in the selling price of the tradables because the increased productivity allows for cheaper production. Alternatively, the selling price of the tradables may remain unchanged, but the wages of the workers involved in their production are raised.
First, we examine the case where the home country's tradable industries lower the prices of the goods and services it produces due to higher productivity. The intensified price competition in the home tradable industries may exert downward price pressure on foreign tradable. If there is no change in productivity in the foreign tradable industries, sales in those industries might decline, leading to a decrease in wages for workers in the foreign tradable industries. If the lower wages cause workers in the tradable industries to switch to the nontradable industries, the labor supply in the nontradable industries will increase, resulting in downward pressure on wages in the nontradable industries. As nontradable industries, such as service industries, are often labor-intensive, and labor costs constitute a significant portion of production costs, lower wages can lead to lower prices. Consequently, the decline in the price of tradables due to their productivity growth can trigger a chain reaction of declining wages and prices in the foreign country.
Likewise, if the home country's tradable industries raise the wages of workers instead of adjusting the selling price, the labor supply in the nontradable industries may decrease as workers in the industries seek employment in the tradable industries for higher wages. Consequently, there will be upward pressure on wages in the nontradable industries, leading to higher prices of nontradables and causing a general rise in prices in the home country.
6 The classification of services does not inherently designate them as nontradables. For instance, when considering educational services, it becomes evident that a significant population of foreign students enroll in universities, resulting in the export of educational services.
7 Regarding tradables, the law of one price cannot be universally assumed to hold true. For instance, when companies establish different markups (the ratio of selling price to marginal cost) for tradables depending on the country of sale, that is, when they adopt the pricing-to-market strategy, it deviates from the principle of one price (Itskhoki, 2021).
8 See Schmitt-Grohe, Uribe and Woodford (2022), Itskhoki (2021), Kawai et al. (2003), and others.
9 The following description is based on Shimizu et al. (2016).
レポート紹介
-
研究領域
-
経済
-
金融・為替
-
資産運用・資産形成
-
年金
-
社会保障制度
-
保険
-
不動産
-
経営・ビジネス
-
暮らし
-
ジェロントロジー(高齢社会総合研究)
-
医療・介護・健康・ヘルスケア
-
政策提言
-
-
注目テーマ・キーワード
-
統計・指標・重要イベント
-
媒体
- アクセスランキング
Copyright © 2016 NLI Research Institute. All rights reserved.