


- NLI Research Institute >
- Economics >
- Japan’s Economic Outlook for the Fiscal Years 2022 to 2024 (February 2023)
15/02/2023
Japan’s Economic Outlook for the Fiscal Years 2022 to 2024 (February 2023)
Economic Research Department Executive Research Fellow Taro Saito


Font size
- S
- M
- L
1. Positive growth of 0.6% per annum from the previous quarter in the October–December quarter of 2022
Real GDP grew 0.2% from the previous quarter (0.6% per annum from the previous quarter) in the October–December quarter of 2022, representing the first positive growth in two quarters.
While private consumption remained strong at 0.5%, capital investment (down 0.5% from the previous quarter) and housing investment (down 0.1% from the previous quarter) declined. This in turn caused domestic demand to decline for the first time in five quarters, but external demand contributed 0.3% (1.4% per annum) to the growth rate. Although the economy grew marginally in the October–December quarter, it failed to recover from its decline in the July–September quarter (down 1.0% per annum from the previous quarter). Indeed, real GDP has seesawed between positive and negative growth for approximately two years.
In the calendar year 2022, the real GDP's growth rate was 1.1% (compared with 2.1% in 2021) and the nominal GDP's growth rate was 1.3% (compared with 1.9% in 2021), meaning that both enjoyed positive growth for the second consecutive year, albeit at a slightly lower level than before the COVID-19 crisis. On a quarterly basis, real GDP in the October–December quarter of 2022 was 1.0% above its pre-COVID-19 level (October–December 2019) but 1.8% below its peak in the July–September quarter of 2019, before the consumption tax rate hike. This indicates that economic normalization is still a long way off.
(Indexes of Business Conditions' underlying assessment is revised downward)
The Cabinet Office Indexes of Business Conditions, released on February 7, showed that the CI coincident index fell for four consecutive months in December 2022, down 0.4 points from the previous month, meaning the CI coincident index's underlying assessment was revised downward from "improving" to "weakening." The main reason for Indexes of Business Conditions' continued decline is that manufacturing activity has been weak due to sluggish exports against a backdrop of slowing overseas economies.
The Cabinet Office Indexes of Business Conditions, released on February 7, showed that the CI coincident index fell for four consecutive months in December 2022, down 0.4 points from the previous month, meaning the CI coincident index's underlying assessment was revised downward from "improving" to "weakening." The main reason for Indexes of Business Conditions' continued decline is that manufacturing activity has been weak due to sluggish exports against a backdrop of slowing overseas economies.
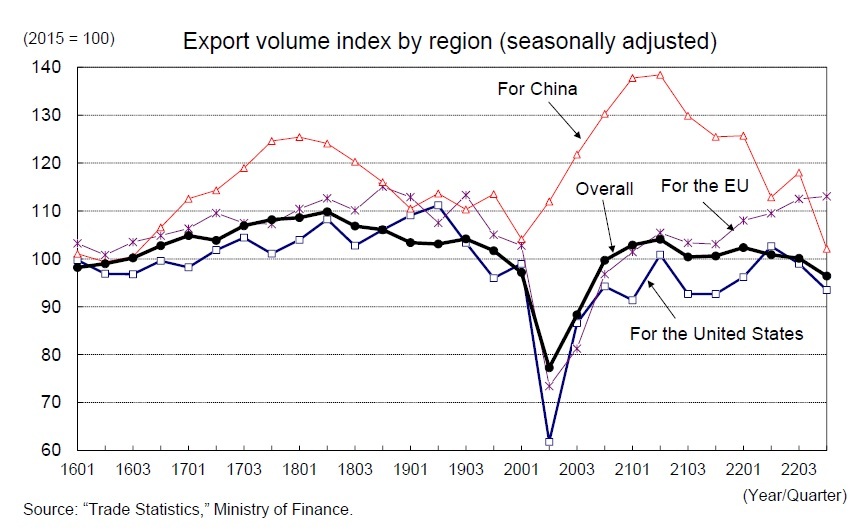 The export volume index (seasonally adjusted by the institute) for the October–December quarter of 2022 declined for the third consecutive quarter to -3.4% from the previous quarter, while the contraction widened from -0.4% in the July–September quarter. Regionally, exports to the EU remained firm, but those to China, whose economy has been in a slump since the spread of COVID-19 after the lifting of the zero-COVID-19 policy, fell sharply, while those to the United States, whose economy has been slowing, remained sluggish. By product category, sales of semiconductors and other electronic components as well as telecommunications equipment and other IT-related products have declined due to sluggish global demand for semiconductors, while sales of automobiles, which are still affected by supply constraints, have been seesawing.
In the July–September quarter of 2022, the Industrial Production Index increased by as much as 5.8% from the previous quarter, but in the October–December period, production decreased by 3.0%—the first decrease in two quarters. Automobiles, which are still affected by supply constraints, decreased by 4.3% from the previous quarter, and electronic components and devices decreased by 5.9% from the previous quarter (down 7.8% in the July–September quarter), reflecting the adjustment of the global IT cycle.
The manufacturing industry production forecast index, which shows companies' production plans, did not rise at all from the previous month in January 2023 but it did increase by 4.1% in February. However, considering that actual production tends to deviate significantly from the forecast index, it can effectively be read as a production cut plan. While domestic demand's steady strength, particularly in consumer spending, will be supportive, production is expected to remain weak for the time being because exports are likely to remain sluggish against the backdrop of deteriorating overseas economies, especially in Europe and the United States.
In the October–December quarter of 2022, real GDP grew at an annualized rate of 2.9% in the United States and at 0.4% in the euro area, but it is expected to contract in the January–March quarter of 2023 due to high inflation and monetary tightening. By contrast, China, which saw growth in real GDP growth rate drop sharply to 3.0% in 2022 from 8.4% in 2021 as a result of its zero-COVID-19 policy and the accompanying lockdown, is likely to recover in 2023 following the end of the zero-COVID-19 policy.
The growth rate of overseas economies, weighted by the weight of Japanese exports, declined by approximately 2% in 2020 as a result of the impact of the COVID-19 virus infection, then increased by as much as 6% in 2021 in response to the decline, but it will slow significantly again to around 3% in 2022 before declining further to the upper 2% range in 2023. This is because China’s real GDP's growth rate is expected to rise from 3% to 5%, the United States’ growth rate will fall to 0.7% in 2023 from 5.9% in 2021 and 2.1% in 2022, and the euro area’s growth rate will drop from 5.2% in 2021 to 3.5% in 2022 and finally to 0.4% in 2023.
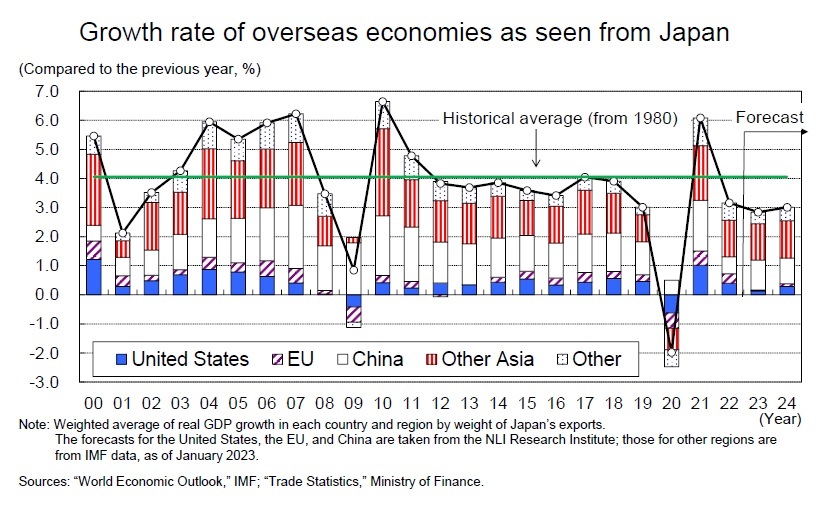 In 2024, China's growth rate will drop to the 4% range, while the US and euro area will grow at slightly higher rates of 1.5% and 1.0%, respectively, so that the growth rate of the overseas economy from Japan's perspective will recover to around 3%, meaning it will remain below the average growth rate of around 4% since 1980.
Exports in FY 2021 grew 12.3% year on year, followed by FY 2022, which is expected to see its growth slow to 4.6% year on year, and FY 2023, which is expected to see a decline to 0.8% year on year for the first time in three years due to a slowdown in overseas economies, although there has been a boost from a weaker yen. In FY 2024, exports will grow 3.1% year on year, but this will not be sufficient to drive the economy to any kind of major success.
(Household savings rate approaches pre-COVID-19 crisis level)
Despite the headwinds of inflation and the spread of the COVID-19 virus, consumer spending continues to show signs of recovery. This is because the repeated restrictions on movement during the COVID-19 crisis and the provision of special fixed benefits has enabled households to drastically reduce their consumption levels and thus make excess savings.
The household savings rate was 1.2% on average between 2015 and 2019 before the COVID-19 crisis, but it surged to 20% in the April–June quarter of 2020 due to a sharp drop in consumption caused by the state of emergency's April 2020 decree and a dramatic increase in disposable income caused by the provision of special fixed benefits. Since then, the savings rate has been on a downward trend, partly because consumption has picked up due to the easing of restrictions on movement, but nevertheless the level remains higher than in normal times.
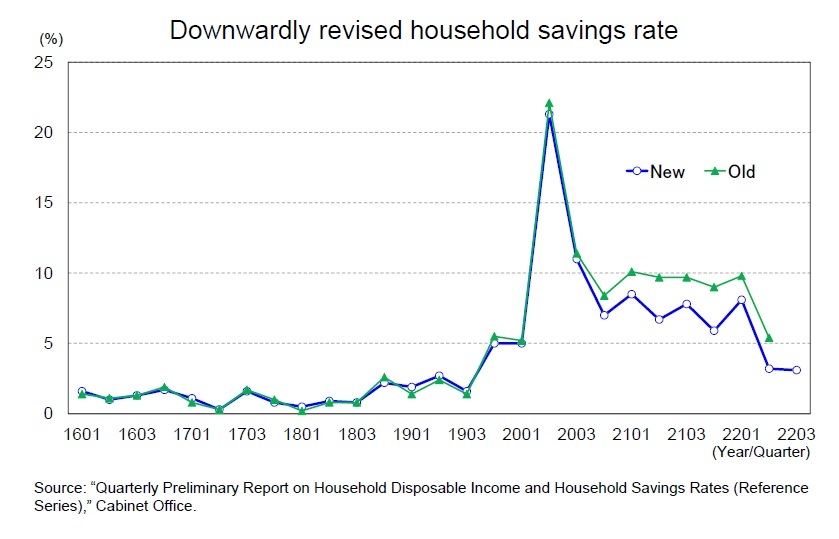 Having said this, the FY 2021 Annual Estimates of the National Accounts released by the Cabinet Office in December 2022 revised downward both FY 2020 (13.1% to 12.1%) and FY 2021 (9.6% to 7.1%) household savings rates. In the April–June quarter of 2022, the household savings rate was revised downward from 5.4% to 3.2%, and in the July–September quarter of 2022 there was a further decline to 3.1%. This means the household savings rate is now closer to pre-COVID-19 levels than previously thought.
Consumer spending has continued to pick up on the back of high savings even as nominal wages have stagnated and real wages have fallen. However, once the household savings rate returns to normal levels, the trend in disposable income, especially wages, will largely determine consumer spending. Hence, we are now approaching a point where wage increases will become more important.
(The spring wage increase rate will reach a 26-year high)
In the spring wage negotiations, Prime Minister Kishida urged the business community to raise wages to above the inflation rate, while the Rengo also raised its wage demand to around 5% from around 4% in the previous year. The momentum for wage hikes has grown significantly in recent years, with a number of companies announcing significant wage hikes.
According to a survey on wage hikes released by the Institute of Labor Administration on January 30, the average wage increase forecast for 2023 (covering approximately 400 employers, labor unions, and labor economy experts) was 2.75%, which was 0.75 percentage points higher than in the previous year. Considering that the Ministry of Health, Labor, and Welfare's data on major companies tend to indicate slightly higher wage increases than was forecast in the survey, our latest forecast assumes a 2.90% spring wage increase rate for 2023 (compared with 2.20% for 2022).
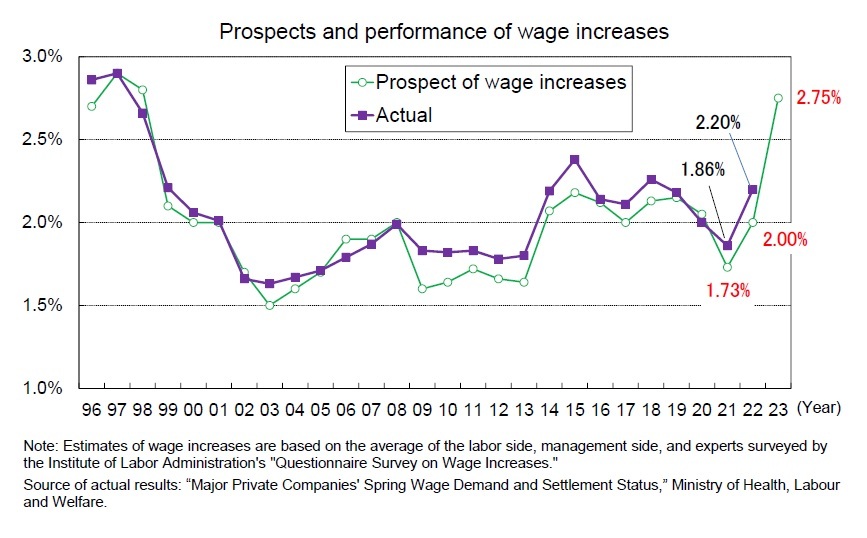 If this projection is realized, the spring wage increase rate would be the highest in 26 years—that is, the highest since 1997. However, the increase, excluding regular wage increases, will be just over 1% in FY 2023, is likely to fall short of consumer price growth following FY 2022’s result. The recent rise in prices is largely a consequence of temporary factors such as the sharp rise in the price of resources and grains and the rapid depreciation of the yen, so it is not realistic for wage growth, which is highly downward rigid and moving stably, to surpass this in the short term. Nevertheless, over the medium to long term, the goal should be for the base increase to exceed the rate of inflation. Assuming that the target for price stability is 2%, a base increase above 2% would be considered as a guideline.
Nominal wages per capita have continued to increase, but real wage growth has been negative since the start of FY 2022 due to a significant increase in the rate of consumer price inflation. Although the spring wage increase rate in 2023 will be significantly higher than in the previous year, the decline in real wages is likely to continue in FY 2023 due to the persistently high rate of consumer price inflation. We expect real wage growth to become positive in the second half of FY 2023, when the rate of consumer price inflation is expected to slow.
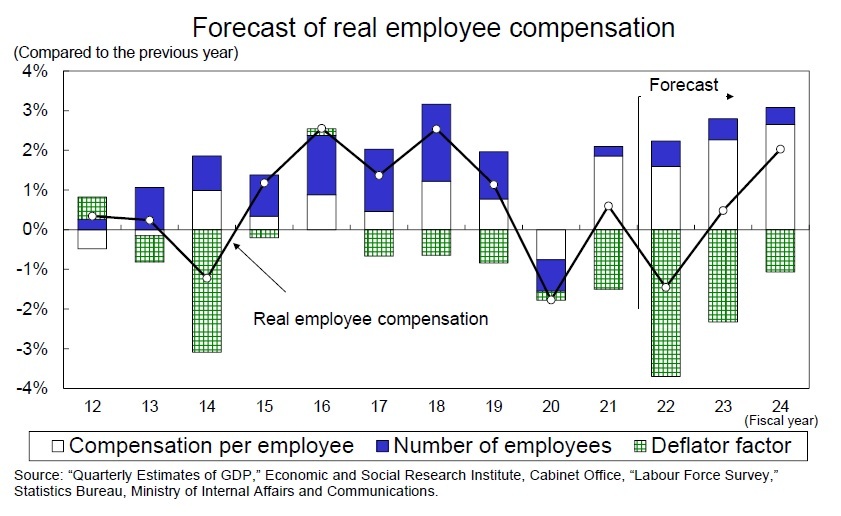 Furthermore, nominal employee compensation in FY 2022 is expected to increase for the second consecutive year to 2.2%, but real employee compensation is expected to decline by 1.5% due to the accelerated pace of consumer price inflation. In FY 2023, nominal employee compensation is expected to increase by 2.8% from the previous year, primarily due to higher per capita wage growth, while real employee compensation is expected to increase by a modest 0.5% from the previous year as the pace of price inflation slows. In FY 2024, employee compensation is expected to increase from the previous year, by 3.1% in nominal terms and 2.0% in real terms.
2. Real GDP growth rate expected to be 1.3% in FY 2022, 1.0% in FY 2023, and 1.6% in FY 2024
(Inflation will be a factor in declining savings)
Consumer spending is still on the rise, but the pace of price increases has led to some sluggish growth.
Consumer spending is still on the rise, but the pace of price increases has led to some sluggish growth.
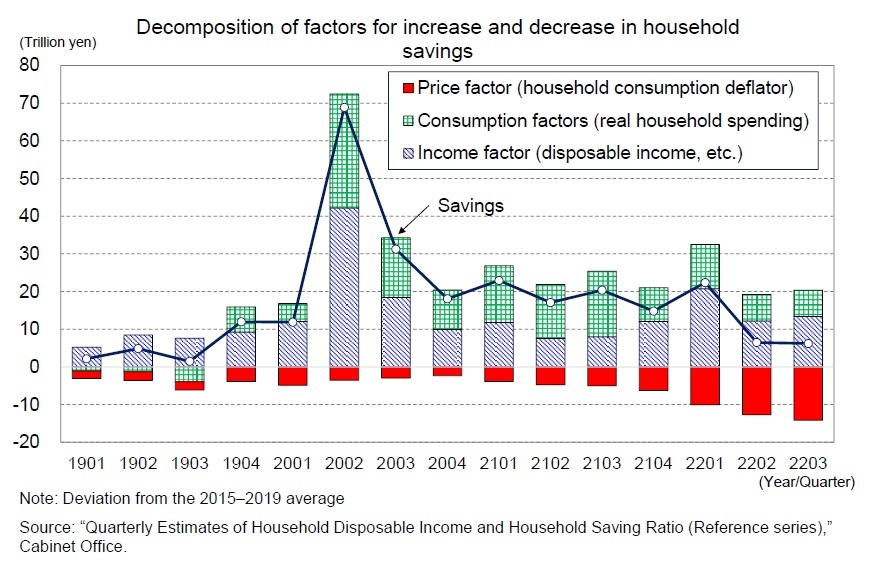 As noted above, household savings remain at a high level, but they are gradually approaching pre-COVID-19 crisis levels. When the gap between household savings during the COVID-19 crisis and normal times (2015–2019 average) is broken down into income factors (disposable income, etc.), consumption factors (real household consumption expenditure), and price factors (household consumption deflator), the decline in consumption levels, various support measures such as special fixed benefits and Go To Travel, and the recovery of employee compensation have contributed to the increase in savings. However, the accelerating pace of price increases has led to a fall in savings. In the July–September quarter of 2022, household savings were 6.2 trillion yen (seasonally adjusted and annualized) higher than normal, but lower consumption levels and an increase in disposable income pushed up 20.1 trillion yen, while price increases pushed down 13.9 trillion yen.
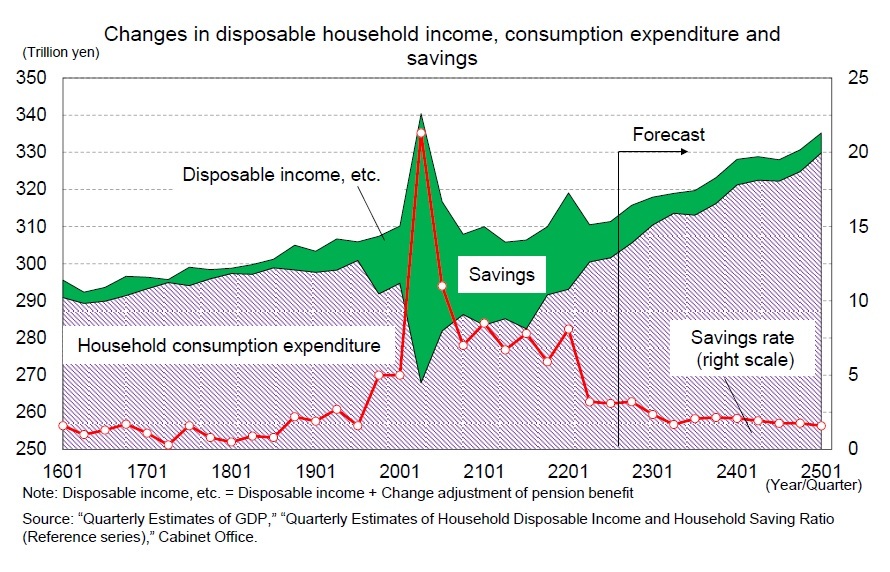 Looking ahead, inflation will continue to drive down savings, while higher wage increases and higher disposable income growth will drive up savings. This forecast assumes that the household savings rate will decline from 3.1% in the most recent period (July–September 2022) to the upper 1% range at the end of the fiscal year 2024, approaching the level it was at prior to the COVID-19 crisis (1.2% of the 2015–2019 average).

03-3512-1836
Copyright © 2016 NLI Research Institute. All rights reserved.