


- NLI Research Institute >
- Economics >
- Japan’s Economic Outlook for Fiscal Years 2022 to 2024 (November 2022)
16/11/2022
Japan’s Economic Outlook for Fiscal Years 2022 to 2024 (November 2022)
Economic Research Department Executive Research Fellow Taro Saito


Font size
- S
- M
- L
1. Negative growth of annualized rate of 1.2% in July–September 2022
In the July–September quarter of 2022, real GDP contracted for the first time in four quarters by 0.3% from the previous quarter (down 1.2% on an annual basis from the previous quarter).
The main reason for the negative growth was that imports grew at a high rate of 5.2% from the previous quarter, far outpacing the growth in exports (1.9%), and the contribution of external demand declined 0.7% from the previous quarter (2.6% annualized), significantly depressing the growth rate. High corporate earnings helped boost capital investment by 1.5%, and despite headwinds from inflation and the spread of COVID-19, domestic demand remained firm, with private consumption rising 0.3%. However, this was not sufficient to make up for the decline in external demand.
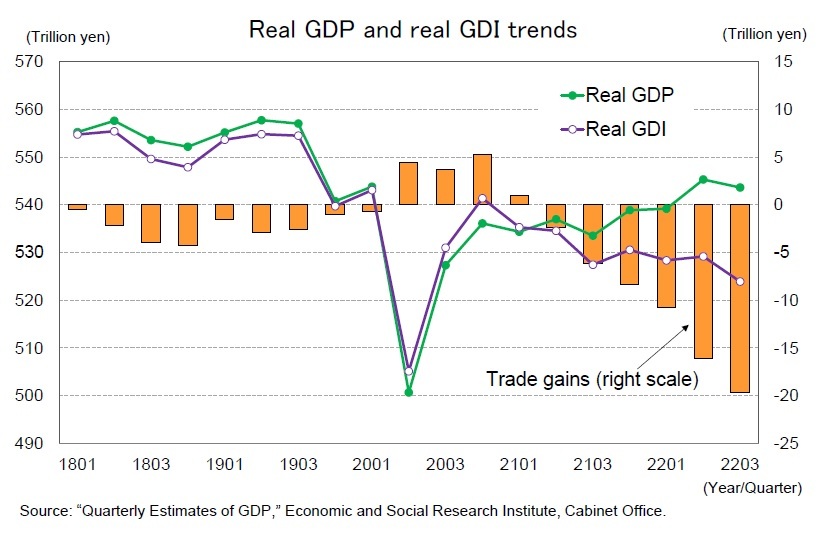
Trade gains (losses), which represent the real amount of income generated by differences in import and export deflators, decreased by 3.6 trillion yen from the previous period. As a result, real GDI, which is the sum of real GDP and trade gains, contracted by 1.0% quarter-on-quarter (an annualized rate of 3.9% quarter-on-quarter), far less than the growth in real GDP.
Japan continues to experience income outflows overseas due to soaring international commodity prices and deteriorating terms of trade due to the weak yen. Trade gains in GDP statistics have declined for seven consecutive quarters since the January–March quarter of 2021, with a decline of 25 trillion yen in trade gains during the current period. In July–September 2022, real GDP was 0.5% above the level of the pre–COVID-19 period (October–December 2019), but real GDI was 2.9% below that of the pre–COVID-19 period.
The main reason for the negative growth was that imports grew at a high rate of 5.2% from the previous quarter, far outpacing the growth in exports (1.9%), and the contribution of external demand declined 0.7% from the previous quarter (2.6% annualized), significantly depressing the growth rate. High corporate earnings helped boost capital investment by 1.5%, and despite headwinds from inflation and the spread of COVID-19, domestic demand remained firm, with private consumption rising 0.3%. However, this was not sufficient to make up for the decline in external demand.
Trade gains (losses), which represent the real amount of income generated by differences in import and export deflators, decreased by 3.6 trillion yen from the previous period. As a result, real GDI, which is the sum of real GDP and trade gains, contracted by 1.0% quarter-on-quarter (an annualized rate of 3.9% quarter-on-quarter), far less than the growth in real GDP.
Japan continues to experience income outflows overseas due to soaring international commodity prices and deteriorating terms of trade due to the weak yen. Trade gains in GDP statistics have declined for seven consecutive quarters since the January–March quarter of 2021, with a decline of 25 trillion yen in trade gains during the current period. In July–September 2022, real GDP was 0.5% above the level of the pre–COVID-19 period (October–December 2019), but real GDI was 2.9% below that of the pre–COVID-19 period.
 The outflow of income to foreign countries due to deteriorating terms of trade will be borne by companies and households. If companies are unable to pass on higher costs associated with higher import prices, corporate profits will be squeezed; if price pass-through is sufficient, the burden on companies will be reduced, while the burden on households will increase through higher consumer prices. Currently, corporate earnings are at record highs, and consumption remains strong on the back of high savings despite headwinds from inflation. Looking ahead, however, there is a risk that domestic demand will be undermined by a decline in real purchasing power at home due to the outflow of income overseas.
(The slowdown of overseas economies becomes clear)
After a sharp slowdown in 2020 due to the impact of the COVID-19 pandemic, the global economy recorded high growth in 2021 partly as a reaction. However, a deceleration trend has emerged recently.
In the July–September quarter of 2022, real GDP grew at an annual rate of 2.6% in the United States and 0.8% in the euro area, but the global PMI continued its downward trend and is currently below the neutral level of 50. Both the United States and the euro area are likely to experience negative growth in the October–December quarter of 2022 and enter recessions as a result of high inflation and monetary tightening to curb it. The period of negative growth is assumed to be three quarters from October–December 2022 to April–June 2023 for the United States and two quarters from October–December 2022 to January–March 2023 for the euro area. China’s economy is also likely to continue to face high downside risks from the country’s zero-COVID policy, although it will continue to improve from the spring of 2020, when it plunged sharply due to the lockdown.
The growth rate of overseas economies, weighted by ’Japan’s exports, declined by approximately 2% in 2020 due to the impact of the COVID-19 pandemic, and then increased by approximately 6% in 2021 as a reaction to the decline. However, it will slow significantly to approximately 3% in 2022, and then further decline to the upper 2% range in 2023. This is because the United States’ real ’GDP’s growth is expected to be −0.2% in 2023 after being 1.8% in 2022 and 5.9% in 2021; the euro area’s GDP’s growth is expected to be −0.2% in 2023 after being 5.2% in 2021 and 3.0% in 2022.
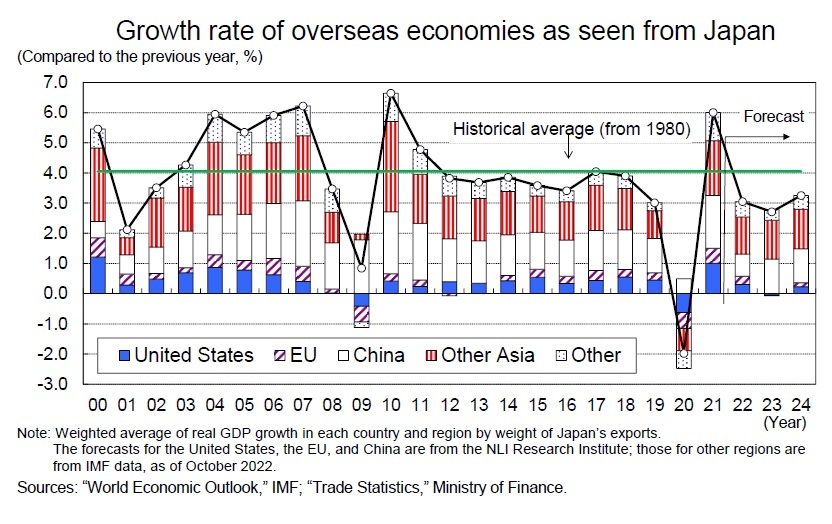 In 2024, with ’China’s real GDP continuing to grow at the 5% level in 2023, and the United States and the euro area returning to modest positive growth of 1.3% and 1.0%, respectively, overseas economic growth for Japan will pick up slightly to the low 3% level, but will remain below the average growth rate since 1980 of approximately 4%.
Exports in FY 2021 grew 12.4% year-on-year, followed by FY 2022, which is expected to see its growth slow to 3.2% year-on-year, and in FY 2023, which is expected to decline 1.4% year-on-year for the first time in three years, due to a slowdown in overseas economies, albeit a boost from a weaker yen. In FY 2024, the figure will increase to 3.3%; however, this is not enough to drive the economy.
(Effects of Policy Measures Against Inflation)
On October 28th, the cabinet approved the Comprehensive Economic Measures to Combat Inflation and Realize Economic Revitalization, and on November 8th, the cabinet approved a FY 2022 supplementary budget with an additional expenditure of 28.9 trillion yen for the general account. The economic measures consist of (1) measures to fight price hikes and support wage increases, (2) recovery and strengthening the country’s earning power by taking advantage of the weak yen, (3) “acceleration of new capitalism,” (4) ensuring the safety and security of the people, and (5) preparation for the future.
On October 28th, the cabinet approved the Comprehensive Economic Measures to Combat Inflation and Realize Economic Revitalization, and on November 8th, the cabinet approved a FY 2022 supplementary budget with an additional expenditure of 28.9 trillion yen for the general account. The economic measures consist of (1) measures to fight price hikes and support wage increases, (2) recovery and strengthening the country’s earning power by taking advantage of the weak yen, (3) “acceleration of new capitalism,” (4) ensuring the safety and security of the people, and (5) preparation for the future.
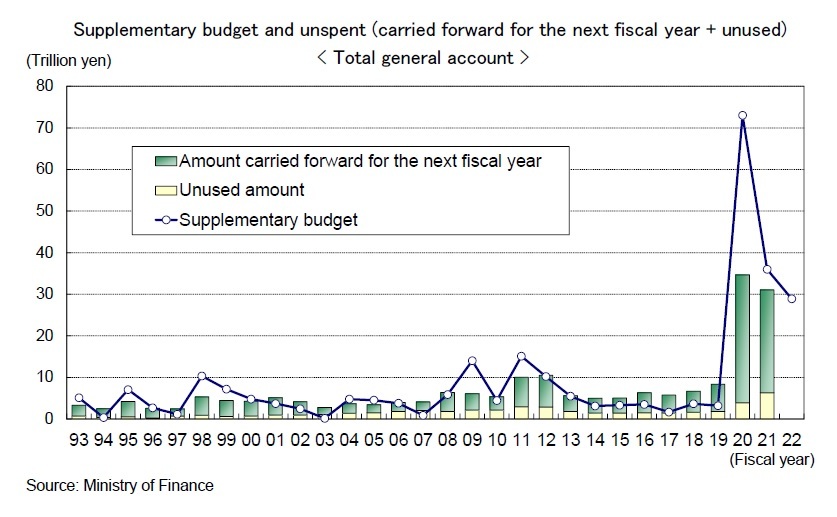 The government estimates that the economic package will boost real GDP by approximately 4.6%.*1 However, this estimate is considered to be excessive considering that since FY 2020, large supplementary budgets associated with economic measures have become a regular occurrence and it is highly likely that the budget will not be fully consumed as the supplementary budget is drawn up near the end of the fiscal year. In fact, unspent budgets are quite large: 34.7 trillion yen (of which the amount carried forward for the following year was 30.8 trillion yen and the amount unused was 3.9 trillion yen) in FY 2020 and 31.1 trillion yen (of which the amount carried forward for the following year was 24.8 trillion yen and the amount unused was 6.3 trillion yen) in FY 2021.
With regard to measures to combat inflation, the government has already implemented price controls on gasoline and kerosene through the mitigation measures of drastic changes in fuel oil prices since January 2022, and the addition of curbs on electricity and city gas charges from January 2023 will further reduce household burdens caused by inflation.
This forecast assumes that the fuel oil price increase mitigation measures will be continued from January 2023 until the end of FY 2024, the end of the forecast period; however, subsidies will be reduced. Although the reduced electricity and gas rates will continue until the end of FY 2024, the mitigation measures will be reduced by half in September 2023. *2
Based on these assumptions, it is estimated that the household burden per household (households of two or more people) in FY 2022 would have ballooned to 149,000 yen if not for the inflation measures. Of this, 58,000 yen, or about 40% of the total, is due to higher energy prices. It is estimated that the burden reduction (total electricity, gas, gasoline, and kerosene) due inflation measures will be 37,000 yen. As a result, FY ’2022’s burden from inflation will be reduced to 112,000 yen per household.
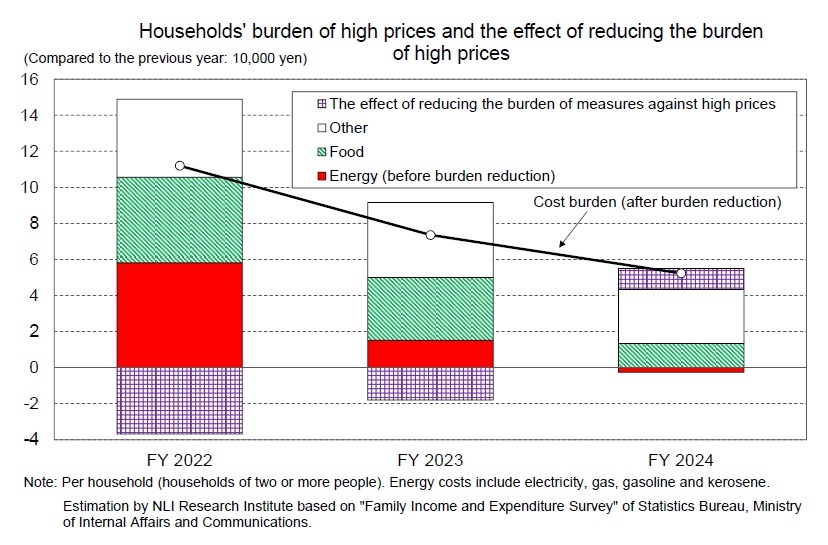 The effects of measures to combat inflation will continue in FY 2023. It is estimated that without these measures the cost to households in FY 2023 would be 92,000 yen, the reduction in the cost by such measures would be 18,000 yen, and the net cost to households would be 74,000 yen.
Since no additional burden reduction measures are projected for FY 2024, the burden on households compared to the previous fiscal years will be more inflated than it would have been without the measures.
*1 Estimates of the boost to real GDP from economic packages are as follows: approximately 4.4% for the Emergency Economic Measures against COVID-19 implemented in April 2020, approximately 3.6% for the Comprehensive Economic Measures for Security and Hope that Protect People’s Lives and Livelihoods implemented in December 2020, and approximately 5.6% for the Economic Measures to Conquer COVID-19 and Create a New Era implemented in November 2021.
*2 In the mitigation measures for the increase in fuel oil prices, the subsidy for fuel is limited to December 2022; however, the economic package states that the subsidy upper limit will be gradually adjusted for gasoline after January 2023, and the subsidy will be gradually reduced after June 2023. The government also stated it would reduce the scope of drastic changes in electricity rates in September 2023.
2. Real growth expected to be 1.6% in FY 2022, 1.0% in FY 2023 and 1.6% in 2024
(Summer 2022 consumption remained firm even during the COVID-19 outbreak)
Service consumption rebounded sharply in the April–June quarter of 2022 following the calming of the COVID-19 pandemic and the end of priority preventative measures, then stalled in the summer as infections once again increased. However, since no special restrictions were imposed and summer festivals and various events were held for the first time in three years, service consumption remained firm to a certain extent, with no fall in crowds as there had been during previous outbreaks.
Service consumption is expected to pick up after October, partly due to a boost from nationwide travel support. However, the deadline for nationwide travel support is December 20. Given the recent resurgence of COVID-19, an extension is likely to be shelved. Consumer spending is expected to stagnate again in winter.
(The environment surrounding wage increases has improved significantly)
Nominal wages per capita fell sharply in FY 2020 due to the impact of the COVID-19 pandemic and have continued to rise since FY 2021; however, real wage growth has remained negative since April 2022 due to the significant rise in consumer price inflation.
The spring wage increase rate in 2022 improved by 0.34 percentage points from the previous year (1.86%) to 2.20% (the status of requests and settlements for spring wage increases by major private companies in the Ministry of Health, Labour and Welfare). The rate of wage increases was higher than the previous year for the first time in four years, but the base increase, excluding regular wage increases of approximately 1.7%−1.8%, remains in the 0% range.−
Looking at the environment surrounding the spring labor offensive in 2023, labor supply and demand remained tight, with the ratio of job offers to applicants remaining well above 1 and the unemployment rate in the mid 2% range. Seasonally adjusted ordinary profit in the Financial Statements statistics of Corporations by industry is at an all-time high, and consumer prices are rising at their fastest pace in nearly 30 years. Thus, the three factors that largely determine the rate of wage increases—labor supply and demand, corporate earnings, and prices—have all improved significantly.
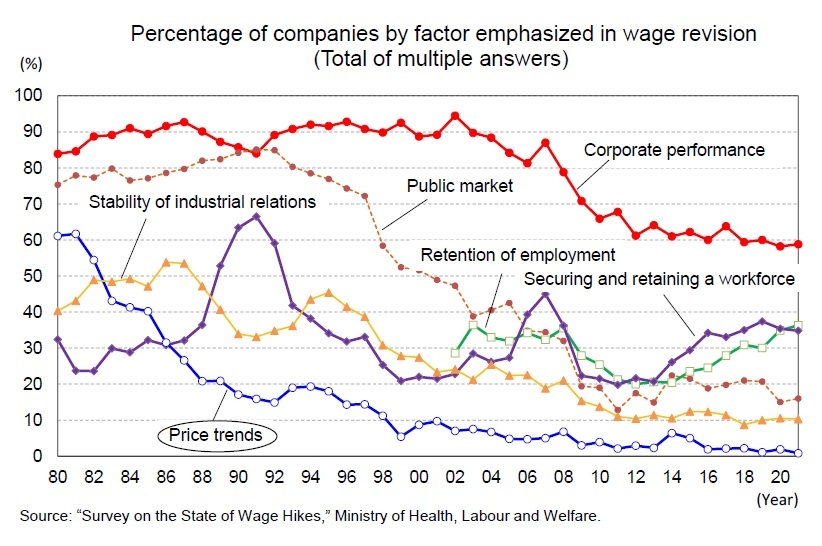 In particular, attention should be paid to price trends, which in recent years have hardly been a factor in wage negotiations. According to the Ministry of Health, Labour and ’Welfare’s Survey on the Actual Condition of Wage Hikes, the percentage of companies that emphasized “price trends” when revising wages (multiple answers allowed) exceeded 60% in 1980. The percentage dropped rapidly in response to price stability that followed, but remained above 10% until the late 1990s. However, after falling below 10% in 1999, it remained in the low single digits for more than 20 years, with a record low of 0.8% in 2021.
However, with consumer prices in FY 2022 growing at such a rapid rate, there is a growing awareness of the erosion of real wages due to inflation and the spring wage negotiations in 2023 are likely to focus more on “price trends.” In fact, the Japanese Trade Union Confederation, also known as RENGO, has increased its demand for wage increases in the 2023 spring offensive to approximately 5%, including the equivalent of regular salary increases, up from around 4%, which it has held since 2016. In addition, the chairperson of the Japan Business Federation (Keidanren) announced that he would call on member companies to raise wages, mainly by raising base salaries across the board.
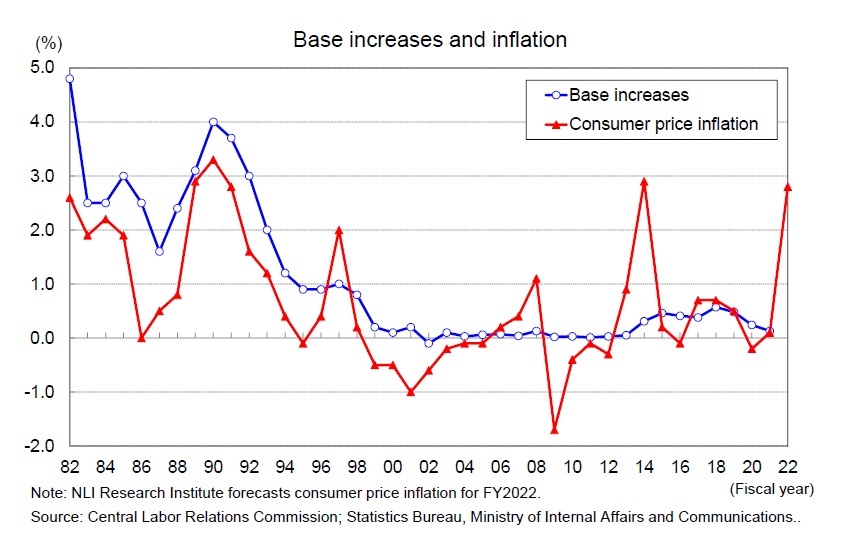 We expect the spring wage increase in 2023 to be 2.75%, an improvement of 0.55 percentage points from the previous year. It is likely to be higher than the 2.38% in 2015, which was the highest since Abenomics began in 2013. Excluding regular salary increases, however, the increase will be only approximately 1%, and FY 2023 is likely to follow FY 2022’s lead and lag behind consumer prices. The recent rise in prices is largely due to temporary factors such as soaring prices of resources and grains and the rapid depreciation of the yen, thus it is difficult for the base increase to exceed these levels all at once. In the medium to long term, however, the goal should be for base increases to exceed inflation, as they did until the mid-1990s. Assuming a price stability target of 2%, a base increase above 2% would be a guide.

03-3512-1836
レポート紹介
-
研究領域
-
経済
-
金融・為替
-
資産運用・資産形成
-
年金
-
社会保障制度
-
保険
-
不動産
-
経営・ビジネス
-
暮らし
-
ジェロントロジー(高齢社会総合研究)
-
医療・介護・健康・ヘルスケア
-
政策提言
-
-
注目テーマ・キーワード
-
統計・指標・重要イベント
-
媒体
- アクセスランキング
Copyright © 2016 NLI Research Institute. All rights reserved.