


- NLI Research Institute >
- Economics >
- Japan’s Economic Outlook for Fiscal 2022 and 2023 (May 2022)
19/05/2022
Japan’s Economic Outlook for Fiscal 2022 and 2023 (May 2022)
Economic Research Department Executive Research Fellow Taro Saito


Font size
- S
- M
- L
1. Annual decline of 1.0% in January-March 2022
In the January-March quarter of 2022, real GDP posted its first negative growth in 2 quarters, down 0.2% from the previous quarter (down 1.0% on an annual basis).
Due to the influence of priority preventative measures, private consumption, especially face-to-face services such as dining out and lodging, decreased slightly by 0.03% from the previous quarter, while the contribution of external demand was significantly reduced by 0.4% from the previous quarter (down 1.7% on an annual basis). Capital investment rose 0.5% from the previous quarter for the second consecutive quarter on the back of high corporate profits, and government consumption rose 0.6%, reflecting the progress of vaccination, although this did not cover the decline in consumption and external demand.
The real GDP growth rate in FY 2021 was 2.1%. Although this was the first positive growth in 3 years, the pace of recovery was extremely slow after the sharp contraction in FY 2020 (- 4.5%).
The Japanese economy registered a record-high annual contraction of 28.2% in the April-June quarter of 2020 due to the impact of the new COVID-19 virus, followed by high growth in the second half of 2020, but repeated contraction and positive growth in 2021. In the United States, real GDP in the April-June quarter of 2021 and that of the Eurozone in the October-December quarter of 2021 exceeded that of the pre-COVID-19 period (October-December 2019), but Japan's real GDP was still 0.7% below that of the pre-COVID-19 period in the January-March quarter of 2022.
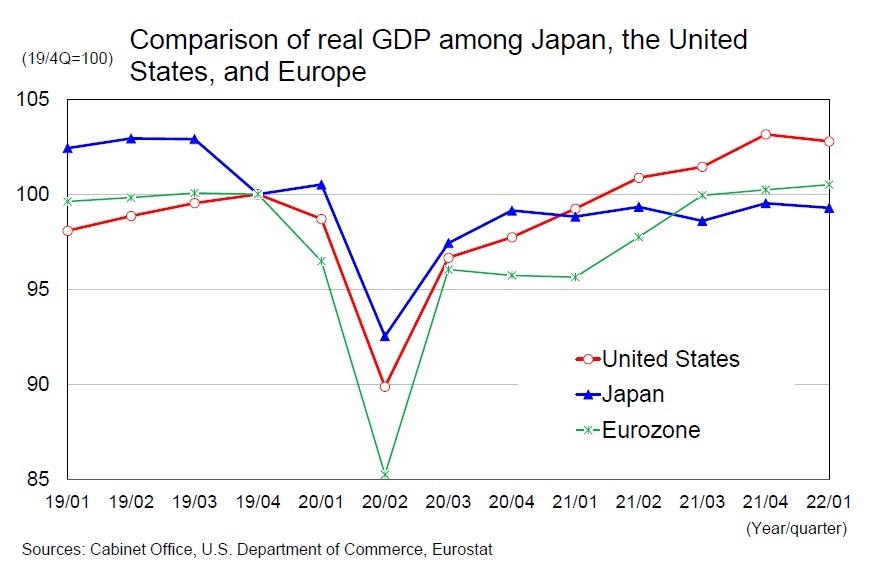 In addition, Japan's economic activity had fallen significantly before the impact of the new COVID-19 virus became apparent, with an annualized decline of 10.8% in the October-December quarter of 2019 from the previous quarter due to the hike in the consumption tax rate. Compared to its most recent peak in the April-June quarter of 2019, real GDP in the January-March quarter of 2022 was 3.5% lower. The normalization of economic activity is a long way off.
(Impact of yen depreciation and high crude oil prices)
The difference in interest rates between Japan and the United States has widened as the FRB has raised its key interest rate to cope with high inflation and Japan has continued its monetary easing policy. The dollar-yen exchange rate and nominal effective exchange rate are at their lowest levels in about 20 years, and the real effective exchange rate is at its weakest level in about 50 years.
The weak yen has both merits and demerits. Advantages of the depreciation of the yen include (1) an increase in exports due to an increase in export volume and export prices through improved price competitiveness, (2) an increase in exports of services, mainly due to inbound tourist demand, and (3) an increase in income received from overseas (in yen terms). On the other hand, there are disadvantages such as (1) the deterioration of corporate profits due to the rise in import costs and (2) the decline in the real purchasing power of households due to the rise in import prices.
We have estimated the export function (real exports) using the real GDP of overseas economies (income factor) and the real effective exchange rate (price factor) as explanatory variables to examine the impact of the depreciation of the yen on exports. We can see that the price elasticity of goods exports has been declining in recent years because the linkage between foreign currency-denominated export prices and exchange rates has been decreasing due to the increase in value added of export items, while the price elasticity of services exports has been rising due to the expansion of inbound demand.
An estimate of the impact of the 10% depreciation of the yen on the external balance shows that the trade balance improved by 3.5 trillion yen in FY 2010, but the improvement in the balance is now 800 billion yen, a significant decrease. [*]1By breakdown, the improvement in the real trade balance shrank from 4 trillion yen in FY 2010 to 2.2 trillion yen, and the deterioration in terms of trade (trade gains and losses) widened from 600 billion yen in FY 2010 to 1.5 trillion yen. On the other hand, exports of services increased by 200 billion yen in FY 2010 and by 800 billion yen now. However, entry restrictions are currently in place as a border measure against the new COVID-19 virus, and unless such immigration restrictions are eased significantly, service exports cannot be expected to benefit from the weak yen.
The primary income balance improved by 2.2 trillion yen compared to 1.4 trillion yen in FY 2010. This is because the primary income balance (income received from overseas minus payments) is larger than in FY 2010 (primary income balance: 13.9 trillion yen in FY 2010 to 21.6 trillion yen in FY 2021), making it easier to benefit from the weaker yen.
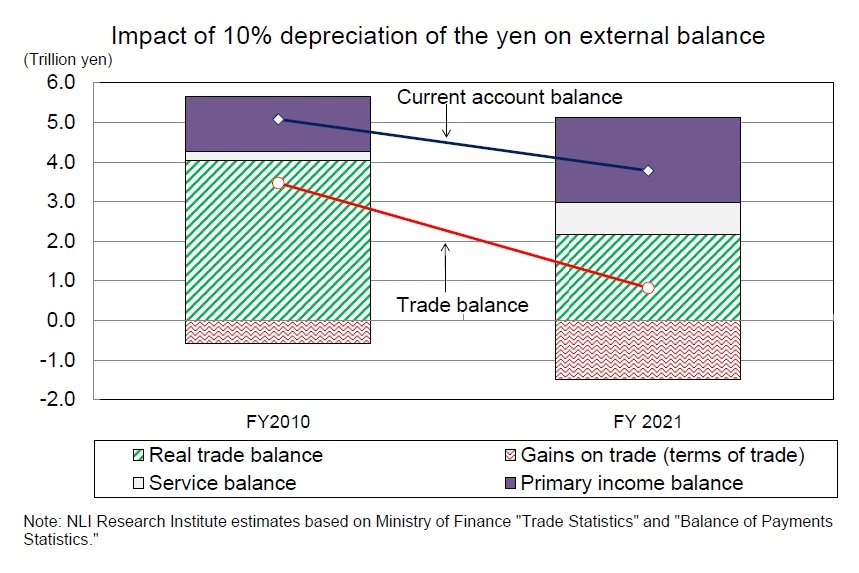 The impact on current account balance — the sum of the balance of trade, the balance of services, and the primary income balance — is that a 10% depreciation of the yen has resulted in an improvement in current account balance of 3.8 trillion yen, compared with 5.1 trillion yen in FY 2010. [*]2The effects of the yen's depreciation are smaller than in the past, but the overall impact on external balance is still positive.
Using our macroeconomic model, we estimate the impact of a weaker yen on the corporate and household sectors. A weaker yen leads to an increase in corporate profits and capital investment through an increase in exports. In addition, the rise in import prices due to the depreciation of the yen initially adversely affects personal consumption through the decline in real income due to the rise in consumer prices, but the positive effects of the spread of improvement in corporate profits to employment and wages subsequently outweigh the negative effects, contributing to a boost in personal consumption.
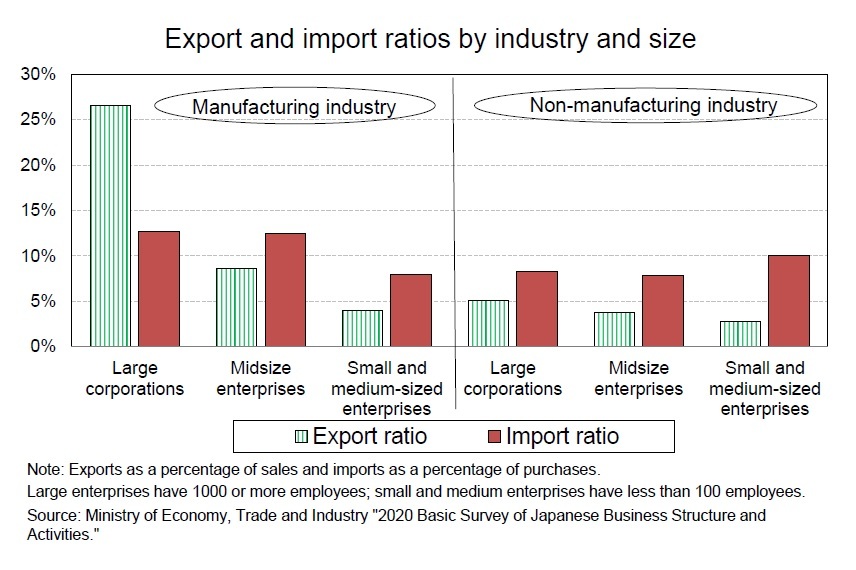 It should be noted, however, that the impact of the yen's depreciation on the corporate sector varies greatly depending on the industry and the size of the company. According to the Ministry of Economy, Trade and Industry's Basic Survey of Japanese Business Structure and Activities, large manufacturers have a high export ratio (exports/sales) and are more likely to benefit from the weak yen, while non-manufacturers have a high import ratio (imports/purchases) and are more likely to be impacted by increased import costs associated with the weak yen. In the manufacturing sector, small and medium-sized firms have lower export ratios and higher import ratios, making them less likely than large firms to benefit from the weak yen.
Thus, while the yen's depreciation has some negative effects, its positive effects on the Japanese economy as a whole are likely to be greater. One of the reasons why the "bad yen depreciation" is attracting attention is that the recent depreciation of the yen has occurred at the same time as the soaring prices of resources such as crude oil and grains such as wheat. The rise in resource prices leads to a decline in corporate profits and a decline in the real purchasing power of households through the outflow of income to foreign countries due to the deterioration of the terms of trade. A weak yen will raise both export and import prices, but the foreign currency-denominated ratio is higher for imports, leading to a deterioration in terms of trade, as is the case with high crude oil prices. At present, most of the deterioration in terms of trade is due to the deterioration of the contract currency base, and the impact of the yen's depreciation is small. However, since the yen's depreciation is working to amplify the negative effects of the rise in crude oil prices (rise in resource and grain prices), the negative aspects of the yen's depreciation are probably being emphasized.
[*]1 Calculated using trade, services, and primary income balance for FY 2021
[*]2 the impact of the secondary income account is excluded
2. Real growth rate is expected to be 2.0% in FY 2022 and 1.7% in FY 2023
(Consumer spending picks up after priority preventative measures end)
With priority preventative measures being ended on March 21st, attendance at retail and entertainment venues highly linked to service consumption picked up and, in Golden Week in May, recovered to levels clearly above those before the COVID-19 pandemic began.
With priority preventative measures being ended on March 21st, attendance at retail and entertainment venues highly linked to service consumption picked up and, in Golden Week in May, recovered to levels clearly above those before the COVID-19 pandemic began.
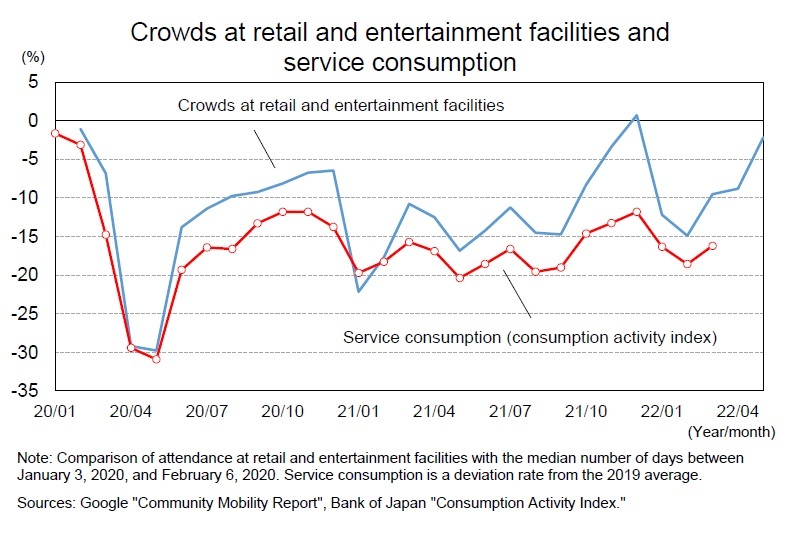 According to the Bank of Japan’s Consumption Activity Index, real service consumption rose 6.3% quarter-on-quarter in the October-December quarter of 2021, then fell 4.4% quarter-on-quarter in the January-March quarter of 2022. On a monthly basis, however, it fell 5.1% month-on-month in January 2022, fell 2.7% in February, and rose 2.9% in March. Service consumption is expected to recover after April, given the movement of people after April.
(Accelerated pace of price increases depresses real income)
The nominal wage per capita fell sharply in FY 2020 due to the impact of the new COVID-19 virus but has been on an upward trend since the beginning of FY 2021. However, the rise in consumer price inflation has been a depressing factor in real wages.
The nominal wage per capita fell sharply in FY 2020 due to the impact of the new COVID-19 virus but has been on an upward trend since the beginning of FY 2021. However, the rise in consumer price inflation has been a depressing factor in real wages.
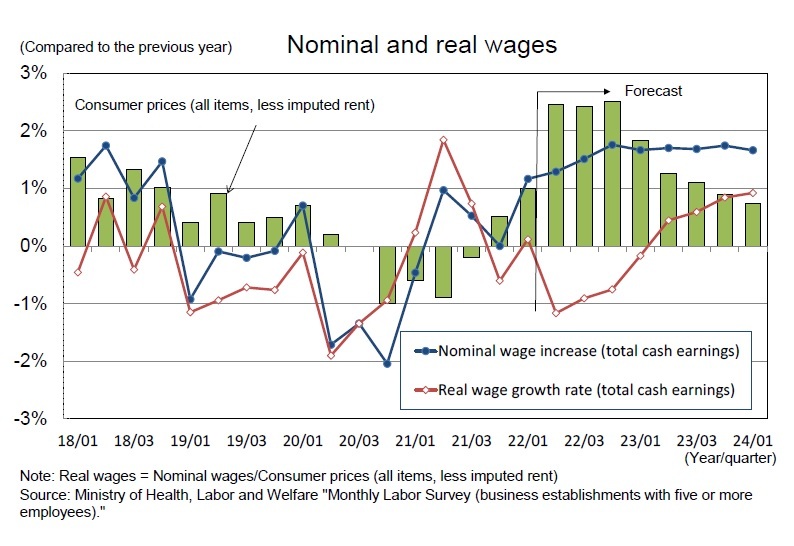 In 2021, the wage increase rate fell below 2% for the first time in 8 years to 1.86% (the state of demands and agreements for wage increases in the spring by major private companies in Ministry of Health, Labour and Welfare), but in 2022, it is certain to rise above that for the previous year for the first time in 4 years due to improvements in corporate performance, and it is highly likely that the rate will again be above 2%. Excluding regular pay increases, which are said to be around 1.7 ~ 1.8%, the base increase will remain at the 0 percent level. As consumer prices in FY 2022 are expected to continue growing by about 2%, it is likely that real wages (per capita) will remain in the negative range.
Nominal employee compensation declined 1.5% in FY 2020 from the previous year, the first decline in 8 years, and then rose by 1.7% in FY 2021. In FY 2022, as the number of employees continues to increase due to the background of the high sense of labor shortages at companies, the nominal compensation of employees is expected to increase by 2.1% from the previous year, reflecting the higher growth in scheduled cash earnings, the higher rate of wage increases in the spring labor offensive compared with the previous year, and the increase in special cash earnings (bonuses), which is closely linked with corporate profits. At the same time, however, the pace of price increases will accelerate, and the growth of real employee compensation is expected to decline significantly from 2.0% in FY 2021 to 0.4% in FY 2022. The growth rate in FY 2023 is expected to rise to 1.8% as the pace of price increases slows.
(Adverse effects of higher prices can be offset by a reduction in the savings rate)
Under normal circumstances, a decline in real income would directly lead to a slump in consumption. However, in the wake of the COVID-19 crisis, the savings rate was much higher than in normal times due to behavioral restrictions, so consumption will continue to be influenced more by trends in the savings rate than by real income.
The amount of household savings increased sharply to 74.7 trillion yen (seasonally adjusted annualized value) in the April-June quarter of 2020, mainly due to the provision of the special fixed benefits, and then decreased to 28.1 trillion yen in the October-December quarter of 2021. However, it still exceeds the level of the pre-COVID-19 period. This is because the household savings rate has remained higher than usual due to restrictions imposed by the state of emergency, although disposable income has declined significantly from its peak due to the full impact of the special fixed benefits.
The household savings rate rose from 1.4% in FY 2018 to 3.7% in FY 2019 and then jumped to 13.1% in FY 2020. On a quarterly basis, it rose to an extremely high level of 21.9% in the April-June quarter of 2020, and then fell to 9.0% in the October-December quarter of 2021, but the level remains high compared to normal times.
As a result of the accumulation of flow savings, household cash and deposits as stock have also increased significantly. The amount of cash and deposits held by households rose at an annual pace of 10 trillion ~ 20 trillion yen from the pre-COVID-19 period to more than 1,000 trillion yen at the end of 2019, but the pace of increase has accelerated due to an increase in savings resulting from the COVID-19 crisis. The balance of cash and deposits for the quarter from October to December 2021 was approximately 1,085 trillion yen (seasonally adjusted value calculated by the Institute), a deviation of approximately 46 trillion yen from the trend during the pre-COVID-19 period.
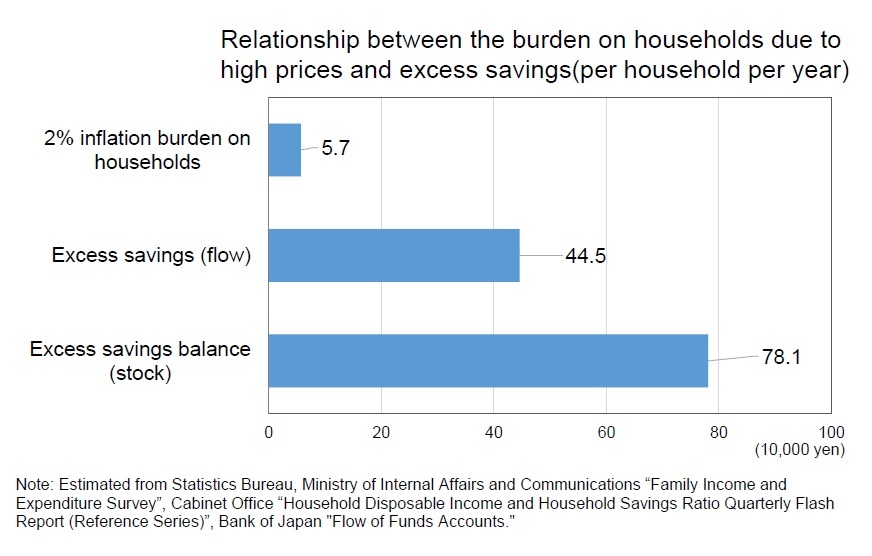 If consumer prices rose by 2% in FY 2022, the annual household burden would increase by 57,000 yen (per household), but the excess savings in 2021 would be estimated at 445,000 yen in flow and 781,000 yen in stock. [*]3,[*]4It is true that the decline in real purchasing power due to price increases will depress consumption, but it is possible to maintain a recovery in consumption if the savings rate can be significantly reduced without imposing restrictions on activity.
[*]3 Household Burden = Estimated based on consumption expenditure in FY 2021 (Family Income and Expenditure Survey, total households) x 2%
[*]4 Excess Savings (Flow) = (Savings in 2021 - (Disposable Income in 2021 + Pension Benefit Adjustment) x Average Savings Rate from 2015 to 2019) ÷ Total Households, Excess Savings (Stock) = Deviation from Trend of Cash and Deposit Balance at End of 2021 ÷ Estimated by Total Households

03-3512-1836
Copyright © 2016 NLI Research Institute. All rights reserved.