


- NLI Research Institute >
- Economics >
- Japanese Property Market Quarterly Review, Third Quarter 2015-Markets Steady but Some Weaknesses Creeping In-
Japanese Property Market Quarterly Review, Third Quarter 2015-Markets Steady but Some Weaknesses Creeping In-
mamoru masumiya


Font size
- S
- M
- L
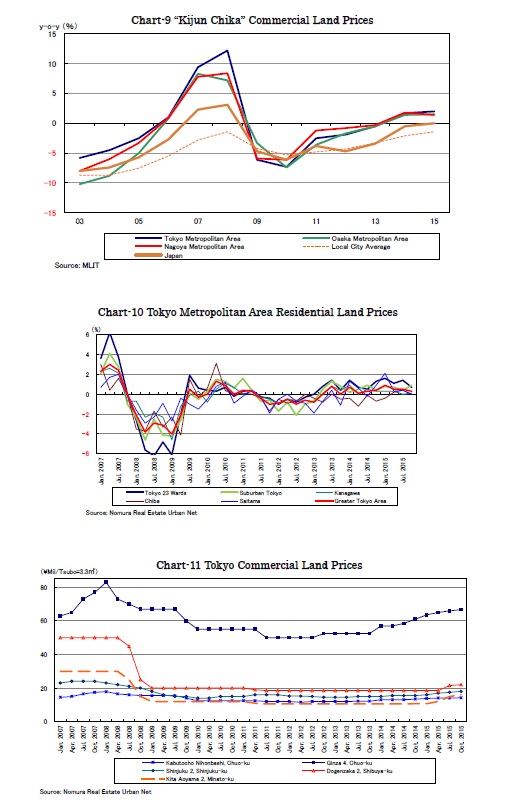
2.Land Prices
According to Nomura Real Estate Urban Net, the average residential land price in the Tokyo metropolitan area appreciated for the eighth consecutive quarter, posting 0.3% q-o-q growth (Chart-10). Residential land prices in the Tokyo 23 wards and greater Tokyo still rose by 0.7% and 0.9% q-o-q respectively, however, it looks like those in the surrounding prefectures of Kanagawa, Saitama and Chiba have already faced difficulties in rising.
Among commercial land prices in the center of Tokyo, those in Ginza appreciated noticeably recovering to the level seen in 2008 (Chart-11).
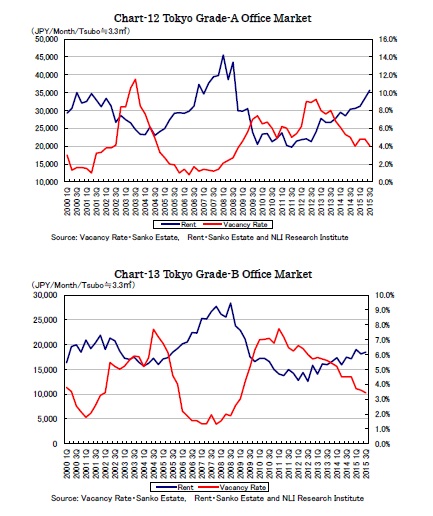
3.Sub-sectors
Vacancy rates of Tokyo grade-A1offices and very large sized offices in the Tokyo major three wards improved by 0.8% and 0.3% q-o-q to 4.0% and 3.7%, respectively, in the third quarter (Chart-12). Moreover, the rising of Tokyo grade-A office rents accelerated, even at a high level, as the office rent index of Tokyo grade-A offices grew by 6.8% q-o-q to 35,652 JPY.
On the other hand, Tokyo grade-B office rents rose only mildly, even though the vacancy rates have improved to a very low level (Chart-13). It seems the market polarization has become increasingly noticeable these few years and more corporate tenants tend to focus on grade-A offices.
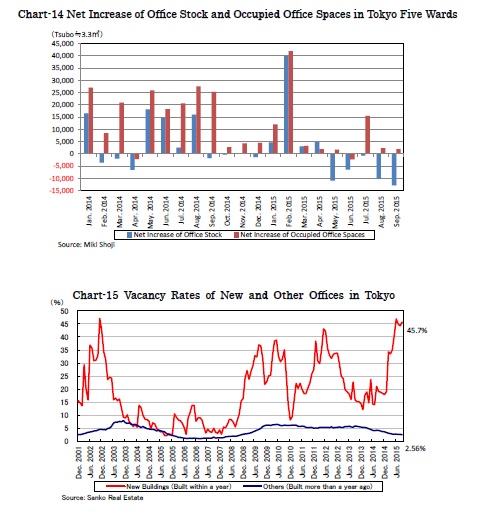
The recent improvement of office vacancy rates has been based on the decrease in office stock, which is apparently different from when it was driven by increasing occupied spaces in 2013 and 2014 (Chart-14). The weak demand has also been noticeable in the new building market. Vacancy rates of new office buildings have outnumbered the peak in 2012 when new building supply swelled significantly (Chart-15). The supply volume this year has been much less than that which was seen in 2012, however, weak demand has made it difficult for new buildings to secure tenants before completion.
Though the low vacancy rates and rising rents are still explaining the strong market, the office demand has weakened affected by the equity market fluctuation from the end of August. From now on, considering the uncertain business conditions in China, the US interest rate hike and the raising of the domestic consumption tax, it has become increasingly difficult to expect the trend in rising office rent to continue.
mamoru masumiya
Research field
Copyright © 2016 NLI Research Institute. All rights reserved.