


- NLI Research Institute >
- Economics >
- Japan's Economic Outlook for Fiscal Years 2024 and 2025 (May 2024)
17/05/2024
Japan's Economic Outlook for Fiscal Years 2024 and 2025 (May 2024)
Economic Research Department Executive Research Fellow Taro Saito


Font size
- S
- M
- L
2.Real growth rate forecast to be 0.8% in FY2024 and 1.1% in FY2025
(Positive growth in April–June quarter of 2024 due to recovery production of automobiles and so on.)
In the January–March quarter of 2024, consumption, capital investment, and exports fell due to the suspension of automobile production and shipments following the revelation of the cheating scandal, whereas prices remained high, resulting in negative growth of -2.0% on an annualized basis from the previous quarter. However, positive growth of 2.3% on an annualized basis is expected for the April–June quarter.
In the January–March quarter of 2024, consumption, capital investment, and exports fell due to the suspension of automobile production and shipments following the revelation of the cheating scandal, whereas prices remained high, resulting in negative growth of -2.0% on an annualized basis from the previous quarter. However, positive growth of 2.3% on an annualized basis is expected for the April–June quarter.
Automobile production in the January–March quarter of 2024 fell sharply by -17.3% from the previous quarter. However, after rapidly declining in January (-15.9% from the previous month) and February (-8.1% from the previous month) on a monthly basis, it grew by a high 9.9% month-on-month in March as factories resumed operations. The production plan for transportation machinery (of which automobiles account for more than 80%) showed high month-on-month growth of 6.1% in April and 10.5% in May. The already-released April 2024 auto sales figures reflect the pickup in production, with an increase of 9.2% from the previous month (seasonally adjusted by the institute).
In the April–June quarter of 2024, unlike the January–March quarter, the recovery in automobile production is expected to boost consumption, capital investment, and exports.
The income and inhabitant tax cuts included in the economic stimulus package formulated in November 2023, scheduled to be implemented in June 2024, will boost private consumption in the July–September quarter, which is expected to grow at a high 3.0% on an annualized basis. Although the effects of the tax cut will only be temporary, consumption will be supported by a sustained increase in real disposable income in the October–December quarter and beyond as real wage growth turns positive. Although capital investment remained sluggish in FY2023, the underlying trend is toward recovery against a backdrop of high corporate profits. From the second half of FY2024, growth will continue to be around 1% per annum, slightly above the potential growth rate of the upper zero percent range, mainly driven by domestic private demand.
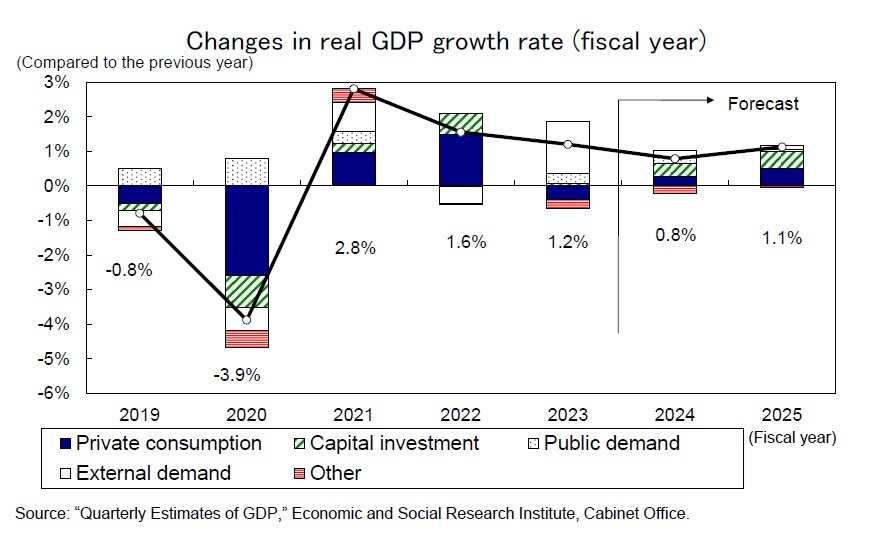 Real GDP growth is forecast to be 0.8% in FY2024 and 1.1% in FY2025. The 1.2% real GDP growth in FY2023 marked the first time in three years that the contribution of domestic demand was negative (-0.2%), whereas the contribution of external demand was significantly higher at 1.5% due to a -3.3% decline in imports compared to the previous year on the back of weak domestic demand. In FY2024 and FY2025, private consumption and capital investment will continue to be the main drivers of domestic demand, while the contribution of external demand will shrink as imports are expected to increase. Growth is expected to remain centered on domestic demand.
(Personal consumption dependent on disposable income)
The household savings rate averaged 1.2% in 2015–2019 before the COVID-19 pandemic but rose sharply to 21.1% in the April–June quarter of 2020. This was due to a sharp drop in consumption following the state of emergency declared in April 2020 and a large increase in disposable income due to the provision of special fixed benefits. Subsequently, the savings rate continued to decline due to a pickup in consumption caused by the easing of action restrictions and higher prices. It has been almost zero since entering FY2023 (0.5% in the April–June quarter, -0.1% in the July–September quarter, and -0.3% in the October–December quarter of FY2023).
The household savings rate averaged 1.2% in 2015–2019 before the COVID-19 pandemic but rose sharply to 21.1% in the April–June quarter of 2020. This was due to a sharp drop in consumption following the state of emergency declared in April 2020 and a large increase in disposable income due to the provision of special fixed benefits. Subsequently, the savings rate continued to decline due to a pickup in consumption caused by the easing of action restrictions and higher prices. It has been almost zero since entering FY2023 (0.5% in the April–June quarter, -0.1% in the July–September quarter, and -0.3% in the October–December quarter of FY2023).
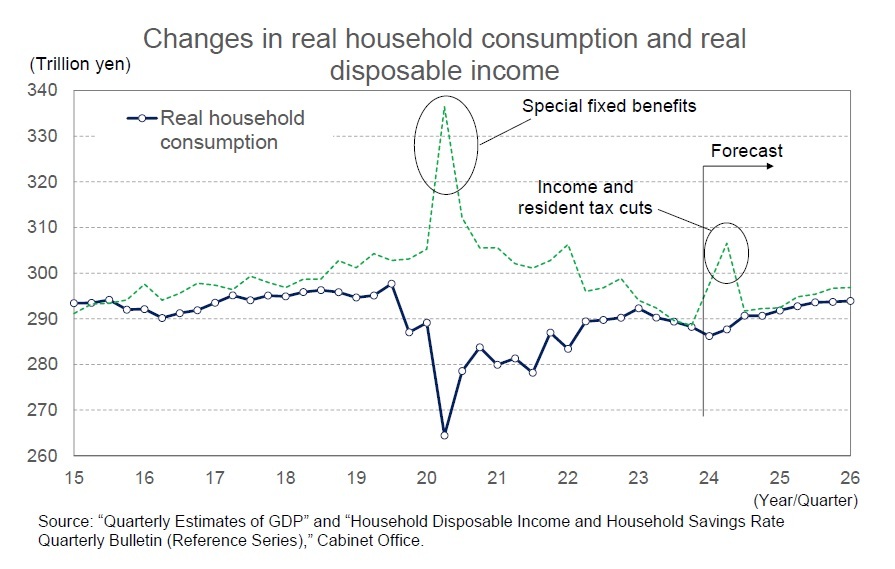 With the household savings rate having fallen to the pre-COVID-19 level and with no hope of a boost from excess savings, real disposable income will determine future consumption. Real disposable income is currently below the pre-COVID-19 level. Inflation will continue to restrain real income, but wage hikes and income and inhabitant tax cuts are expected to provide a boost. Although the effect of the tax cuts will be temporary, real disposable income is expected to remain firm from the second half of FY2024, mainly due to an increase in real employee compensation as the rate of inflation slows.
Since only 20–30% of the tax cuts are expected to go to consumption, the household savings rate will temporarily rise significantly. However, after the tax cut effects wear off, it is expected to decline to almost zero.
Private consumption declined -0.6% compared to the previous year in FY2023, the first decline in three years, but is expected to increase by 0.5% in FY2024, followed by an increase of 1.0% in FY2025. Although the effect of the tax cuts will wear off in FY2025, higher growth in real employee compensation will contribute to the increase in disposable income.
(Businesses have a strong appetite for capital investment)
Capital investment in FY2023 grew at a modest 0.4% compared to the previous year. However, it is expected to remain steady at 2.4% in FY2024 and 2.9% in FY2025.
In the Bank of Japan’s March 2024 Tankan survey, capital investment plans for FY2023 (all sizes and all industries, including software and R&D investment but excluding land investment) were revised downward by -1.9% from the December 2023 survey but still showed a significant growth of 10.2% compared to the previous year. The initial plan for FY2024 is 4.5% year on year, which is approximately the same level of growth as the FY2023 initial plan (4.4% year on year).
Although capital investment in the GDP statistics has been sluggish partly due to supply constraints caused by labor shortages, the underlying trend appears to be recovering. This is mainly in response to labor shortages, telework-related investment, and software investment for digitization, supported by high corporate earnings.
A major influence on medium- to long-term trends in capital investment is the expected growth rate of companies. One reason for the long-term sluggishness in expected growth rates can be attributed to the belief among many corporate managers that a shrinking domestic market is inevitable due to a declining population.
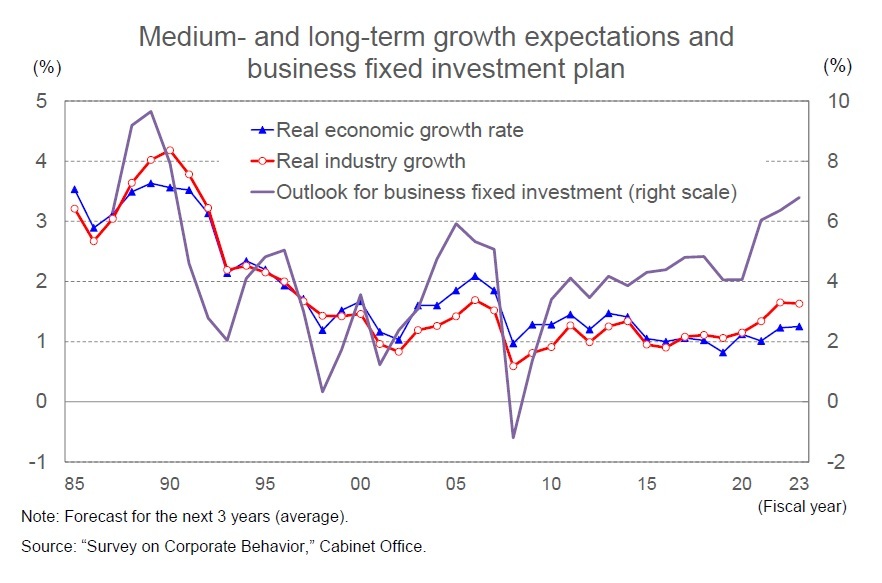 According to the Cabinet Office’s Questionnaire Survey on Business Behavior (FY2023), firms’ outlook for real economic growth over the next three years increased modestly from the previous year for the second consecutive year, reaching 1.3%. Additionally, the real growth rate forecast for their industry demand had been lower than the real economic growth rate forecast for 18 consecutive years since FY1999, but since FY2017, it has exceeded the real economic growth rate, reaching 1.6% in FY 2023. The upturn in industry demand growth expectations is a positive aspect of the outlook for capital investment. Furthermore, the outlook for capital investment is 6.8% in FY2023 (the annual average for the next three years), the highest level in 33 years since FY1990 (7.9%). Although supply constraints due to labor shortages are slowing construction progress in some respects, the willingness of companies to make capital investments appears very strong.

03-3512-1836
レポート紹介
-
研究領域
-
経済
-
金融・為替
-
資産運用・資産形成
-
年金
-
社会保障制度
-
保険
-
不動産
-
経営・ビジネス
-
暮らし
-
ジェロントロジー(高齢社会総合研究)
-
医療・介護・健康・ヘルスケア
-
政策提言
-
-
注目テーマ・キーワード
-
統計・指標・重要イベント
-
媒体
- アクセスランキング
Copyright © 2016 NLI Research Institute. All rights reserved.