


- NLI Research Institute >
- Economics >
- Japan's Economic Outlook for Fiscal Years 2021 and 2022
17/08/2021
Japan's Economic Outlook for Fiscal Years 2021 and 2022
Economic Research Department Executive Research Fellow Taro Saito


Font size
- S
- M
- L
1. The economy grew at an annualized rate of 1.3% in the April–June quarter of 2021
In the April–June quarter of 2021, real GDP grew 0.3% (1.3% per annum) from the previous quarter, the first positive growth in two quarters.
Although the contribution of external demand declined for the second consecutive quarter by 0.3% (an annual slump of 1.3%) from the previous quarter, even with the declaration of the state of emergency, private consumption (0.8%), housing investment (2.1%), and capital investment (1.7%) in private demand all climbed, covering the reduction in external demand. Public investment saw a decline, but public demand was also boosted as government consumption rose 0.5% from the previous quarter, reflecting the progress of vaccinations.
Real GDP in the April–June quarter of 2021 posted its first positive growth in two quarters but has not recovered the drop in the January–March quarter 2021 (down 0.9% from the previous quarter and 3.7% per annum). After posting record-high negative growth in the April–June quarter of 2020, the Japanese economy recorded double-digit annual growth for two consecutive quarters, but has remained stagnant since the beginning of 2021, when the state of emergency was reissued.
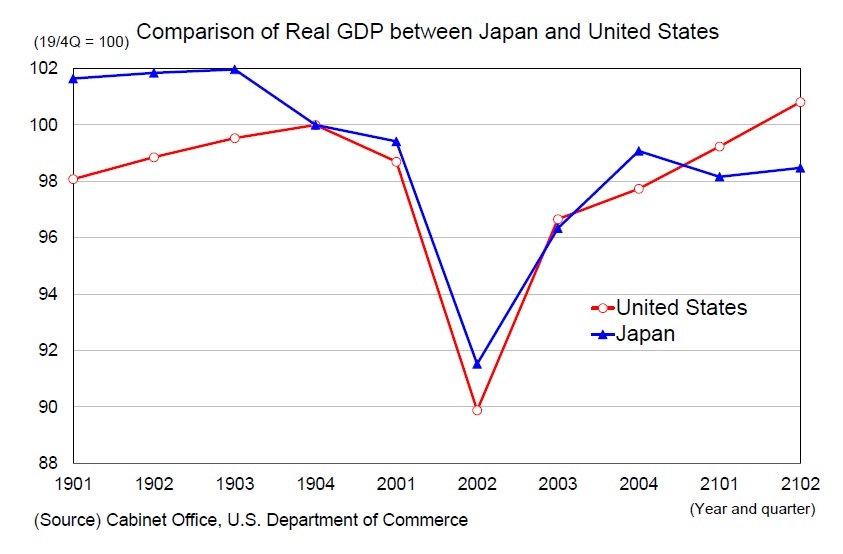 (Growing gap in growth rates between Japan and the United States)
In 2021, U.S. growth in the April–June quarter was 6.5%, while Japan’s growth was only 1.3%. Compared to pre-coronavirus levels of real GDP (October–December quarter 2019), the U.S. was 0.8% above while Japan was 1.5% below. Looking back at developments in real GDP during the COVID-19 pandemic, the decline in the first half of 2020 was greater in the United States where the lockdown was implemented, and it rapidly recovered at about the same pace in the second half of 2020. As of the October–December quarter of 2020, Japan was slightly above the United States in real GDP compared to pre-coronavirus levels. In 2021, however, while the United States continued to enjoy high economic growth thanks to the relaxation of restrictions on activities in line with the progress of vaccination, Japan’s economic activities again stagnated due to the declaration of a state of emergency and the priority preventative measures to prevent the spread of the disease. As a result, the gap between the growth rates in the United States and Japan widened rapidly.
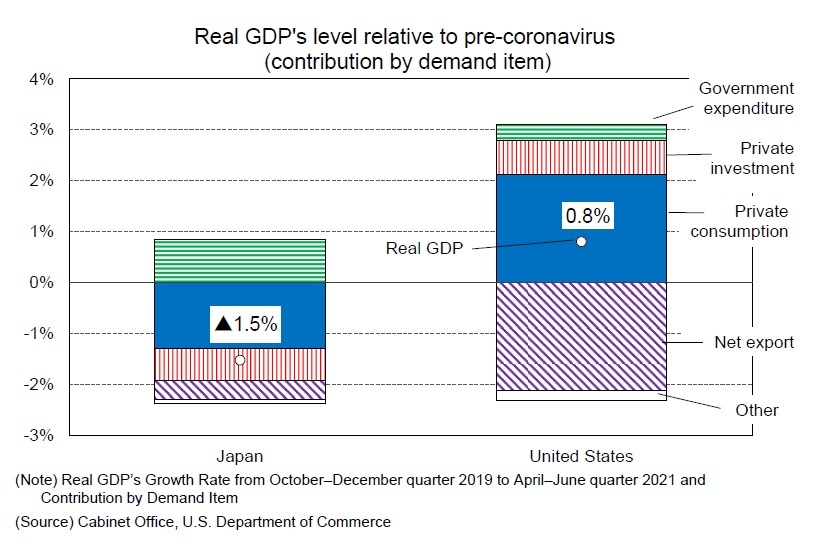 Looking at real GDP in the April–June quarter of 2021 by demand category compared to pre-coronavirus levels, the United States’ exports remain below pre-coronavirus levels and imports remain strong. Therefore net exports pushed down real GDP by 2.1%, whereas personal consumption is 3.1% higher than pre-coronavirus levels and pushed up real GDP by 2.1%. Private investment (housing and capital investment) is also higher than pre-coronavirus levels.
In Japan, meanwhile, personal consumption has fallen 2.4% compared to pre-coronavirus levels, pushing real GDP down 1.3%, even as government spending is pushing real GDP up 0.9% in the wake of coronavirus response measures and other factors. Private investment (housing and capital investment) also saw strong growth in the April–June quarter of 2021, but remains below pre-coronavirus levels.
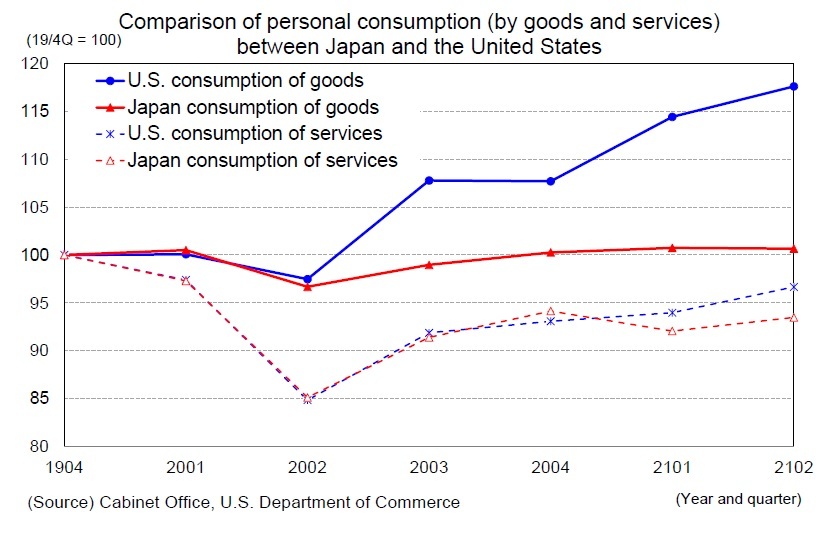 The main reason for the differences in growth rates between Japan and the United States is the significant variance in consumer spending. Examining trends in personal consumption in Japan and the United States in the wake of the coronavirus disaster by goods, there was little difference between Japan and the United States regarding consumption until the April–June quarter of 2020. However, growth since the July–September quarter of 2020 has been much higher in the United States than in Japan. This disparity is due to the higher percentage of online shopping in the United States, the larger size of household benefits, and the greater growth in disposable income than in Japan. The latest real household disposable income has increased by 6.4% compared with pre-coronavirus levels in the United States, while it has remained at 0.2% in Japan (Japan’s most recent data covered the January–March quarter in 2021, due to statistical constraints).
Service consumption remained almost the same in Japan and the United States in 2020, but since the beginning of 2021, the United States has continued to recover with the relaxation of social distancing in line with the progress of vaccination, whereas Japan has seen sluggish recovery from the enforcement of restrictions on activities. Comparing the crowds at retail and entertainment facilities, which is closely linked to service consumption, the decline in the United States was consistently large until approximately the beginning of 2021. Since April 2021, however, the decline in Japan has greatly exceeded that of the United States.
2. Real growth rate is expected to be 3.1% in FY 2021 and 2.0% in FY 2022
 (July–September quarter is also expected to remain sluggish.)
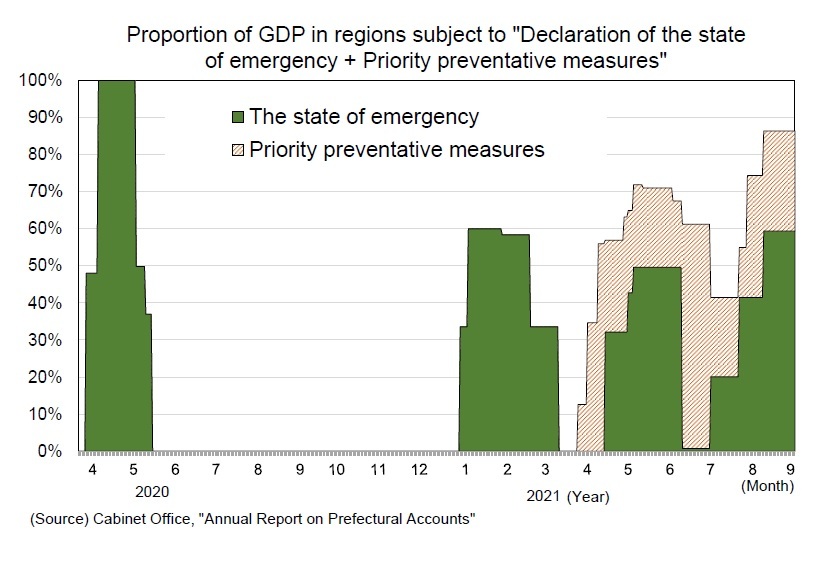
In Japan, either a declaration of a state of emergency or priority preventative measures have been implemented in most of 2021. Both measures were not performed for only a brief period of time, from January 1 to 7 and March 22 to April 4. In 2021, the January–March and April–June quarters accounted for 40% and 55% of Japan’s GDP, respectively, of the regions subject to the declaration of the state of emergency and the priority preventative measures. However, the ratio has risen to 74% at present (August 17) and to 86% from August 20. Although the government’s declaration of the state of emergency has been less effective in curbing the flow of people due to the effects of the coronavirus and fatigue from voluntary restraint, it is highly likely that this summer’s crowds will be lower than last year’s.
Summer is the season when travel demand is usually high. According to the Japan Travel Bureau’s “Travel Outlook for Summer Vacations,” the number of people traveling in Japan during summer vacation in 2021 is estimated to be 40 million, up 5.3% from the previous year (and reduced 44.8% from the year before last). This survey, estimated by the Japan Travel Bureau based on travel trends, economic indicators, industry trends, and bookings, was based on a survey conducted before a state of emergency was declared in Tokyo on July 12 (the survey period covered July 5–9). Therefore, there is a high possibility that the actual number of travelers will be smaller.
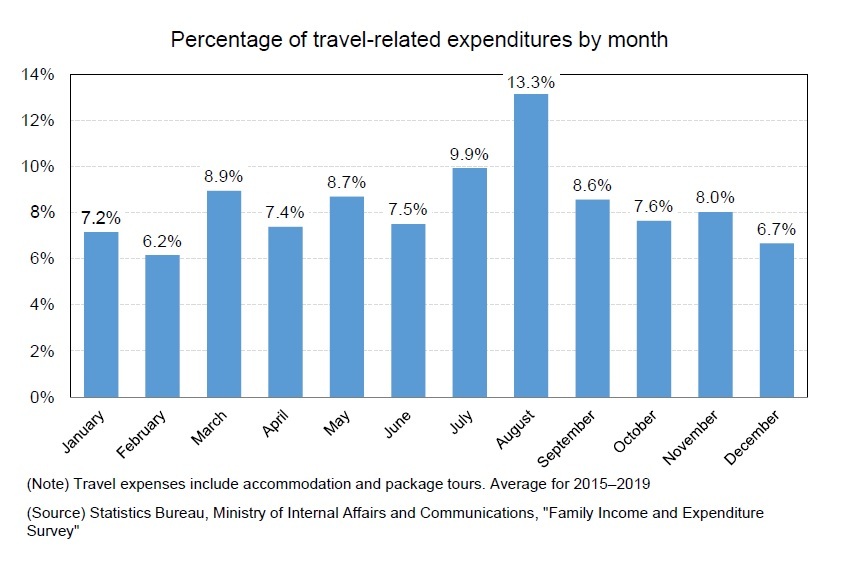 The monthly ratio of travel expenses (accommodation + package tour expenses) in the Family Income and Expenditure Survey (Statistics Bureau, Ministry of Internal Affairs)was 9.9% in July, 13.3% in August, and 8.6% in September (average from 2015 to 2019), with the July–September quarter accounting for more than 30% of the total. Cancellations are expected to continue amid calls to refrain from traveling in the wake of the coronavirus outbreak. The drop in travel spending will have a greater impact on overall consumer spending than in other quarters.
(Exports and capital investment will support the economy)
Private consumption is likely to remain sluggish for a long time due to the declaration of the state of emergency. However, unlike spring 2020, demand items other than private consumption are less susceptible to the declaration.
Private consumption is likely to remain sluggish for a long time due to the declaration of the state of emergency. However, unlike spring 2020, demand items other than private consumption are less susceptible to the declaration.
Exports dropped sharply in the first half of 2020 due to the effects of overseas lockdowns, then recovered sharply in the second half of 2020 due to the resumption of global economic activity and continued to be strong in 2021. By product category, automobile-related products remained sluggish due to the semiconductor shortage, but information-related products and capital goods remained strong against the background of expansion of digital-related demand and recovery in global capital investment. While exports have already recovered to pre-coronavirus levels, the pace of growth has slowed, but the outlook is expected to remain robust against the backdrop of a global economic recovery.
Capital investment decreased 6.8% from the previous year in FY 2020 due to a significant drop in corporate earnings caused by the novel coronavirus. In 2021, even though a state of emergency was declared in the April–June quarter, capital investment expanded 1.7% from the previous quarter.
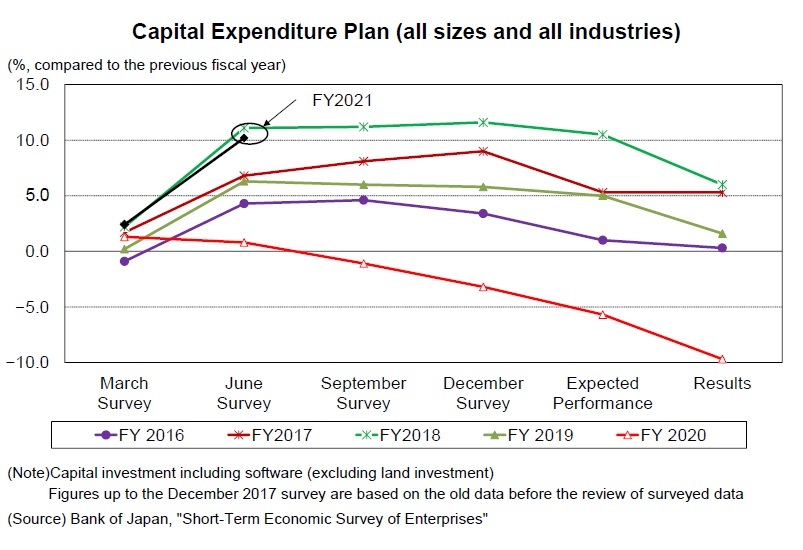 According to the Bank of Japan’s Tankan survey conducted in June 2021, capital investment in FY 2020 (total size and industry, including software investment and excluding land investment) was drastically revised downward from March 2021, and decreased by 9.7% from the previous year—the first decrease in a decade. In contrast, capital investment plans for FY 2021 were revised upward by 2.9% from the March 2021 survey to 10.2% from the previous year. While corporate earnings have improved significantly, particularly in the manufacturing sector, capital investment has picked up, mainly in software investment for telework expansion and digitization, and machinery investments as a result of strong production activities in the manufacturing sector. Looking ahead, although construction investment in the face-to-face service industry will continue to be a downward factor, overall capital investment is expected to continue to recover due to an improvement in machinery- and digital-related investments.

03-3512-1836
Social media account
レポート紹介
-
研究領域
-
経済
-
金融・為替
-
資産運用・資産形成
-
年金
-
社会保障制度
-
保険
-
不動産
-
経営・ビジネス
-
暮らし
-
ジェロントロジー(高齢社会総合研究)
-
医療・介護・健康・ヘルスケア
-
政策提言
-
-
注目テーマ・キーワード
-
統計・指標・重要イベント
-
媒体
- アクセスランキング
Copyright © 2016 NLI Research Institute. All rights reserved.