


- NLI Research Institute >
- Real estate >
- Japanese Property Market Quarterly Review, Third Quarter 2016-Inbound Demand Peaks Out Affecting Retail Stores and Hotels-
Japanese Property Market Quarterly Review, Third Quarter 2016-Inbound Demand Peaks Out Affecting Retail Stores and Hotels-
mamoru masumiya


Font size
- S
- M
- L
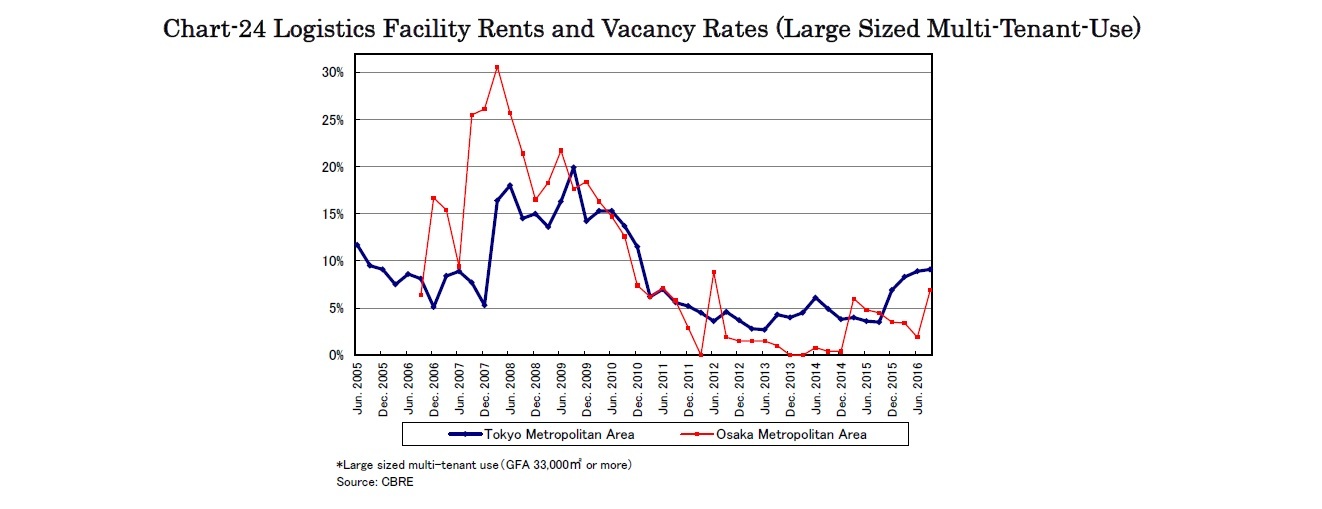
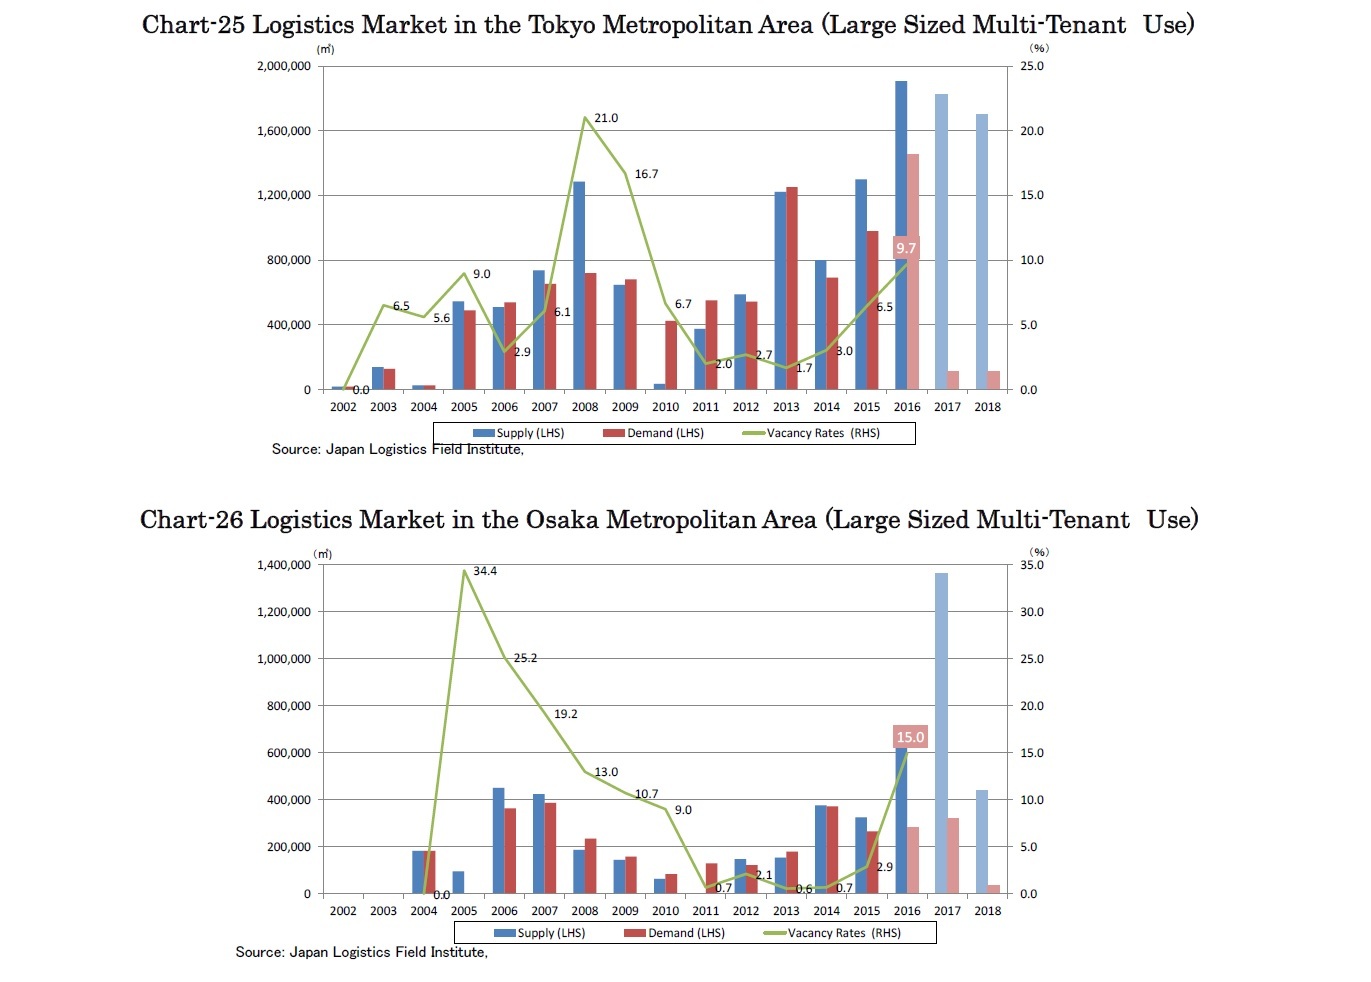
Logistics facility demand has continuously emerged and absorbed new supply. However, vacancy rates in areas along with Ken-O-Do which is quite far from the center of Tokyo rose above 20% in the third quarter. Supply volume will be smaller for the time being, however, as another round of massive supply will come in the second quarter of 2017.
4.Property Investment and J-REIT Markets
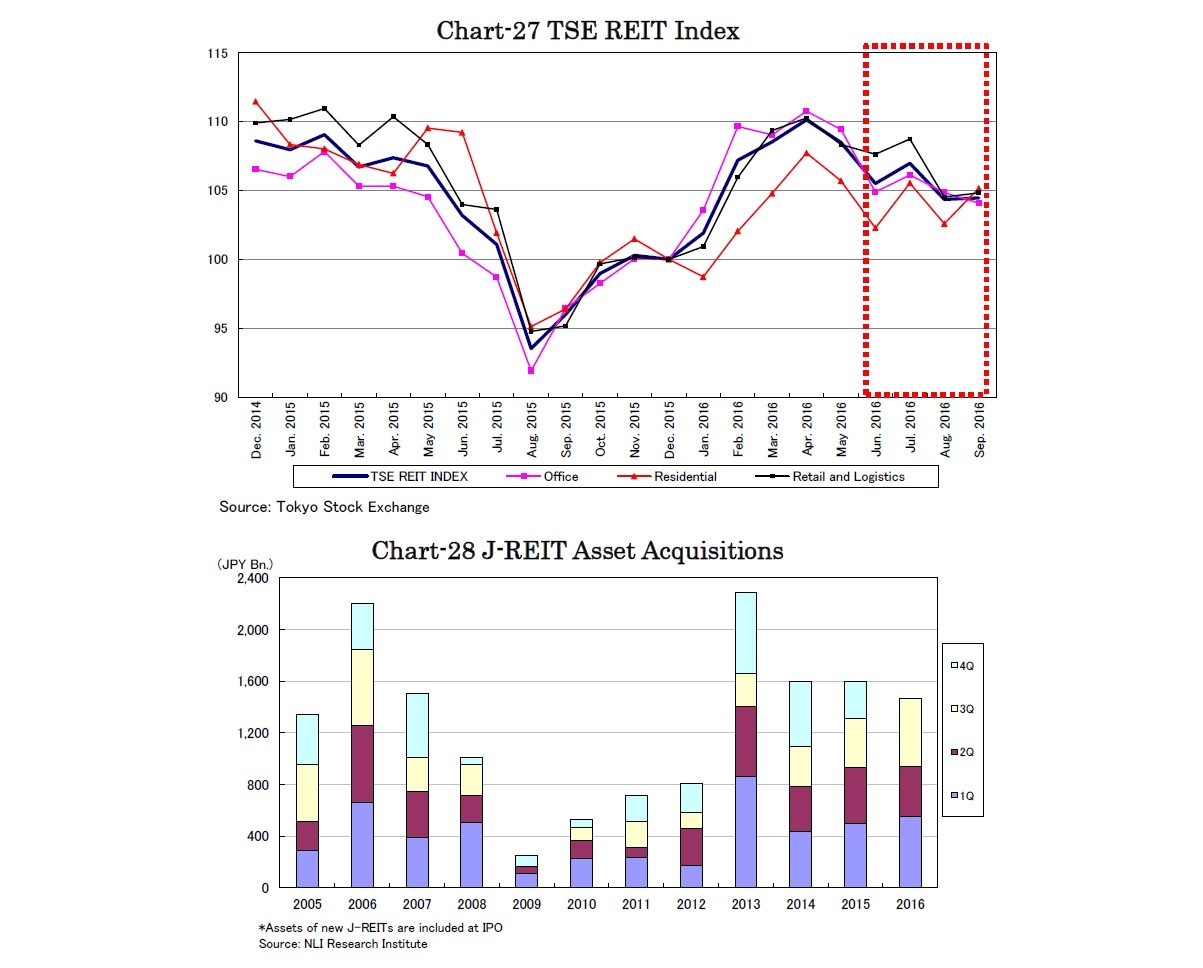
J-REITs acquired properties amounting to 526 billion JPY in the third quarter, totaling 1.46 trillion JPY for September in 2016 (Chart-28). Four REITs were newly listed and two REITs disappeared in mergers, bringing the number of J-REITs to 56.
Dividends of J-REITs have been increasing based on asset acquisitions, funding cost control and NOI increase of existing office buildings. NOI of office buildings owned by J-REITs increased by 2.4% a year, 0.8% y-o-y in the latter half of 2015 and 1.6% in the former half of 2016. Nippon Building Fund REIT, the largest office J-REIT, says that the NOI of existing buildings will increase at least for a year. As offices account for 40% of J-REIT portfolios, dividends of J-REITs will keep growing for a while.
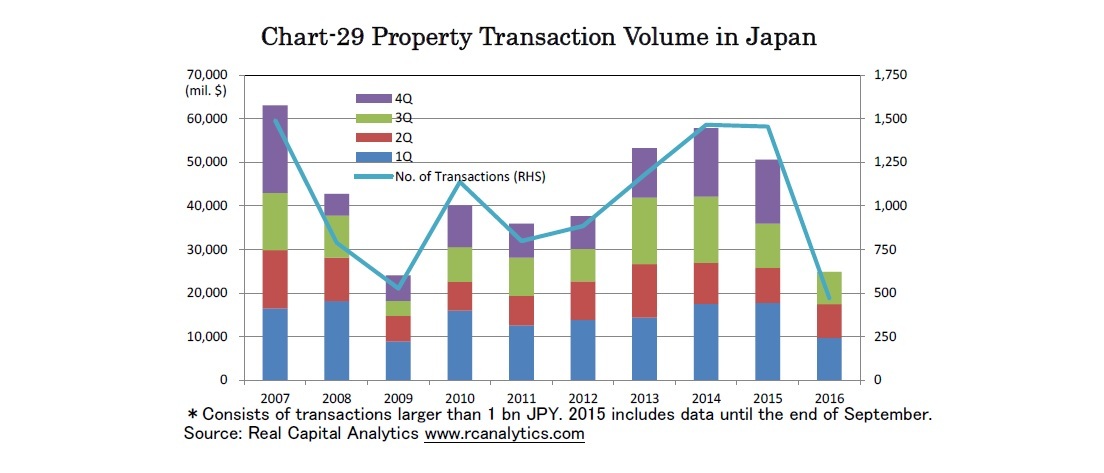
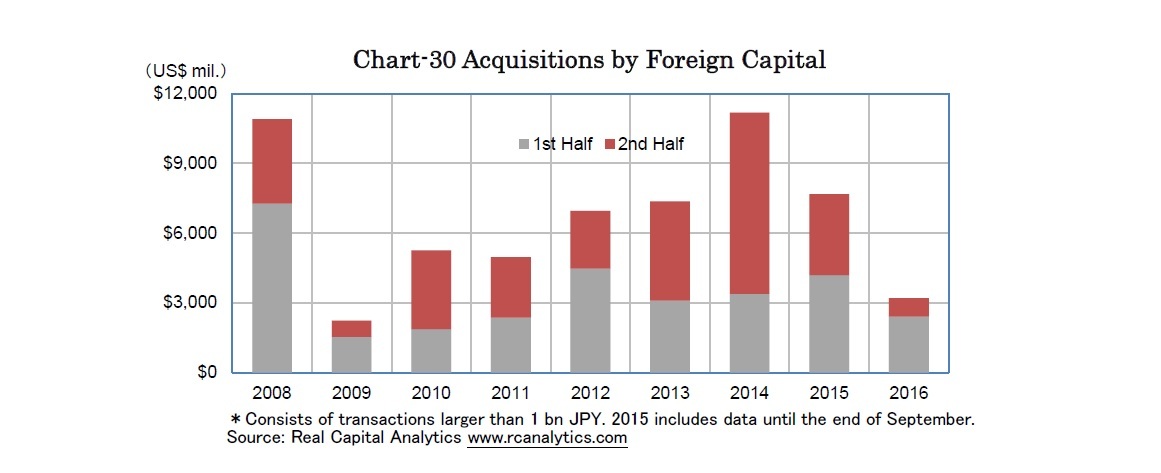
Foreign investors acquired a shrinking volume of Japanese properties (Chart-30). Due to the termination of JPY depreciation Japanese assets appear no longer particularly cheap. Furthermore, under the negative interest rate policy, competition among Japanese investors to acquire assets has been increasingly tough.
mamoru masumiya
Research field
Social media account
レポート紹介
-
研究領域
-
経済
-
金融・為替
-
資産運用・資産形成
-
年金
-
社会保障制度
-
保険
-
不動産
-
経営・ビジネス
-
暮らし
-
ジェロントロジー(高齢社会総合研究)
-
医療・介護・健康・ヘルスケア
-
政策提言
-
-
注目テーマ・キーワード
-
統計・指標・重要イベント
-
媒体
- アクセスランキング
Copyright © 2016 NLI Research Institute. All rights reserved.