


- NLI Research Institute >
- The Present Status of Stock Cross-Holdings and Long-term Holdings
The Present Status of Stock Cross-Holdings and Long-term Holdings
Hideaki Inoue


Font size
- S
- M
- L
(1) Introduction
Observers have repeatedly pointed out a characteristic feature of Japan's stock market − the structure of stock cross-holdings and long-term holdings.
Recent changes in the environment surrounding stock markets and stock prices have heightened the need to clarify these structures:
- The stock market's persistent slump since the collapse of the bubble has revealed how badly exposed financial institutions are to the risks of stock ownership. Amid waning financial soundness, these institutions face growing pressure to reduce cross-holdings and long-term holdings.
- Since cross-holding structures are interrelated, should banks reduce their long-term holdings, operating companies are also likely to reduce their holdings of financial stocks.
- The recent spate of scandals involving Japanese companies has raised awareness of the need to change the economic system, where stability of management provided by cross-holdings and long-term holdings has been a key to success.
- As the economy and stock markets slump and the aging of society accelerates, the influence of pension fund management (particularly involving overseas investors) on the stock market and stock price formation is growing.1
(2) Survey Outline
1. Scope of Survey
The survey covers domestic companies listed on stock markets and OTC-registered companies at the end of the fiscal year. The stockholders are listed companies, OTC companies, and life insurance companies. At the end of March 1997, there were 2,346 listed companies and 779 OTC companies, for a total of 3,125 companies.
2. Content of Data
The data is compiled from Yuka Shoken Hokokusho corporate securities reports (Nihon Keizai Shimbun) and data of major stockholders (Toyo Keizai Shinposha).2
3. Compilation Date
The data is compiled on the account settlement date of companies during the fiscal year ending in March of each year. However, revisions are made when stockholder rankings change due to mergers, capital additions, etc.
(3) Definition of Terms
The following terms are used in compiling and analyzing cross-holding and long-term holding data.
- Financial institution: Unless otherwise specified, refers to banks (excluding trust banks and Daiwa Bank) and life insurance companies. Non-life insurance companies have a negligible effect on the analysis and are excluded.
- Non-financial company: Domestic companies excluding financial institutions, non-life insurance companies, securities companies, and other financial companies.
- Cross-held stock: The stocks that two companies hold in each other.
- Cross-holding ratio: The proportion of stock cross-holdings in the total stock holdings of a corporate group.
- Company cross-holding ratio: The proportion of a company's outstanding stock that is cross-held.
- Long-term holding (cross-holding broadly defined): The total of cross-holdings, stocks held by financial institutions, and financial stocks held by non-financial companies.
- Long-term holding ratio (cross-holding ratio broadly defined): The proportion of long-term stockholdings in a corporate group.
- Company long-term holding ratio (company cross-holding ratio broadly defined): The proportion of a company's stock held by long-term investors.
- Keiretsu group: The six corporate groups which member companies participate in − Mitsui (Second Thursday Club), Mitsubishi (Friday Club), Sumitomo (Hakusui Club), Fuyo (Fuyo Club), Sanwa (Third Wednesday Club), and Daiichi Kangyo Bank (Third Friday Club).
The Survey of the Status of Stock Distribution (FY 1996) covers 67.2 percent of the market value of holdings of banks, 76.0 percent of life insurance companies, and 63.3 percent of operating companies, for a total of 65.0 percent.
For the purpose of discussing the overall stock market, the above results were extrapolated to the overall market.
Even without coverage revision, it would be logical to simply aggregate the major stockholders (the top twenty) because the size of holdings is substantial in the case of stock cross-holdings. However, coverage revision was chosen because: (1) stock cross-holdings are already mature, and large changes in the value or size of holdings are assumed to be infrequent, and (2) movements among the top twenty stockholders significantly affects aggregations, causing shifts in the data.
(5) Handling of Stockholdings of Trust Banks
According to BOJ banking account statistics at the end of fiscal 1996, the banking accounts of trust banks stood at ¥7.00 trillion, banking accounts of trust banks at ¥31.47 trillion, and securities held for securities investment trust at ¥7.48 trillion, for a stockholding total of approximately ¥46 trillion. The fiscal 1996 survey on distribution of stock also shows stockholdings of ¥37.57 trillion. However, at least half of the holdings of trust banks is estimated to be in name only, and not actually stock cross-holdings or long-term holdings−corporate pension trust funds, security investment trusts, other individual annuities, and a portion of corporate pension funds entrusted to investment advisers (all fiduciary trusts). In addition, this portion cannot be distinguished in the publicly available data. Thus we excluded the stockholdings of trust banks (including Daiwa Bank) from the aggregate. Also for the same reason, we excluded the special accounts of life insurance companies.
However, in the long term, with the stockholdings of pension trusts and security investment trusts expected to increase, the exclusion of trust banks from the analysis may lead to relatively exaggerated estimates of stock cross-holdings and stable holdings. Thus further thought is needed on how to include trust banks in future analyses.
2. Survey Results
(1) Status of Stock Cross-Holding and Long-term Holding
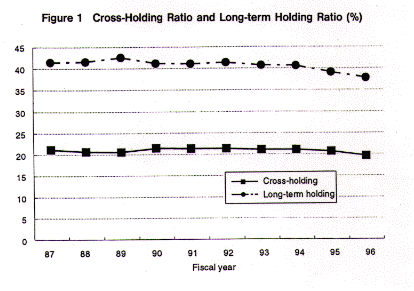
As of the end of March 1997, the cross-holding ratio stood at 19.63 percent and the long-term holding ratio at 37.82 percent. These results and the stock distribution survey results are shown in Figure 1.
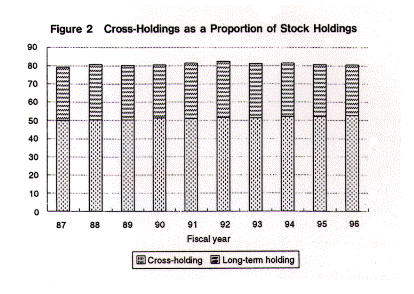
Both ratios are the lowest in the past decade. The cross-holding ratio's decline of 1.12 percent was the largest on record, while the long-term holding ratio's 1.29 percent decline was second only to last year. Thus both cross-holding and long-term holding patterns seem to be gradually waning. However, the decline in the cross-holding ratio can be attributed to the growing movement led by financial institutions to reduce stockholdings, causing both ratios to decline. This view is supported by the fact that cross-holdings and long-term holdings of financial institutions and operating companies have been stable as a proportion to total stockholdings (Figure 2).
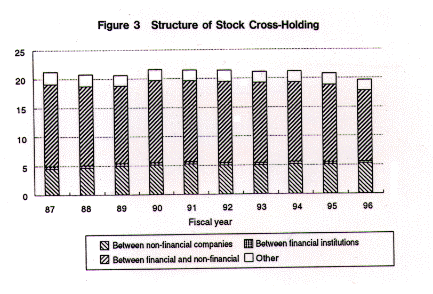
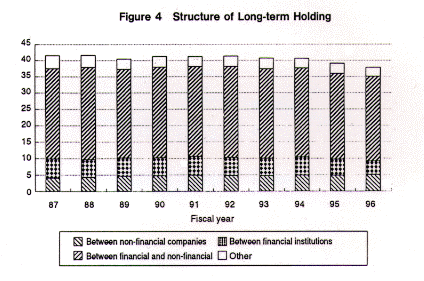
In addition, looking at the changes in the structure of holdings, we see significant declines in cross-holdings and long-term holdings of financial stocks, as well as stockholdings of financial institutions in non-financial companies (Figures 3 and 4).
For example, at the end of fiscal 1996, the cross-holdings of operating companies in financial stocks fell 1.49 percent to 4.28 percent, a 3.04 percent decline from the peak in fiscal 1987. However, we should point out that bank stocks experienced significant price declines, amplifying the changes on a value basis.
(2) Stability of Management Through Cross-Holding
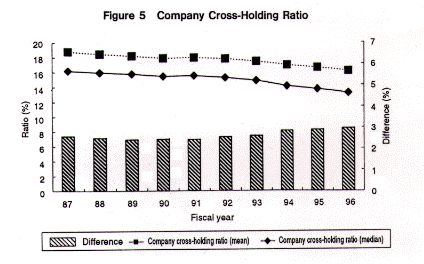
Figure 5 shows a structure of management stability due to the company cross-holding ratio. At the end of March 1997, the company cross-holding ratio stood at 16.17 percent, the lowest in the past decade.
Because the formative period of stock cross-holding overlapped with an era of capital liberalization, one objective of cross-holding was to prevent foreign capital from acquiring controlling stakes. However, this practical role later declined due to the economy's expansion, rising stock prices, and maturation of management stability under cross-holding.3
Thus as we noted in the previous section, judging from (1) the larger decline in the company long-term holding ratio than in the company cross-holding ratio, and (2) growing differences between mean and median values of both ratios, we can see that the reduction of stock holdings is being led by companies with low long-term holding and cross-holding ratios.
(3) Reduction of Cross-Holding
Traditionally, the objectives of cross-holding have been (1) management stability, (2) investment returns from rising stock prices, and (3) security in forming closer business ties (formation of keiretsu).
As already noted, with the decline in the practical role of producing management stability, cross-holding nowadays is affected more by the latter two objectives.
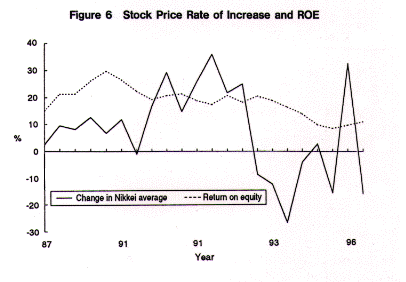
With regard to the second objective of obtaining investment returns, cross-holding increased during the 1980s as stocks continually outperformed returns on owned capital and contributed significantly to corporate earnings (we pointed out the fragility of cross-holding with respect to stock price trends in "Are Stocks an Attractive Investment?" Kisoken Chosa Geppo, November 1993). In the 1990s, the collapse of the bubble and ensuing recession, bad loan problem, plunging stock prices, the expanded stock holdings were a drag on corporate earnings. For this reason, stock holdings as well as fragile cross-holding relationships were predicted to be reduced.
The third objective of assuring close business ties was criticized by the U.S. during the 1989 Structural Impediments Initiative. The U.S. brought up keiretsu relationships and Japan's exclusive business practices, claiming that cross-holding and other practices promote exclusive transactions. In August 1990, the Japanese government stated that "Keiretsu relationships have a certain economic rationality, such as boosting efficiency through stable transactions and fostering a long-term outlook among corporate management. However, at the same time, if they also cause anti-competitive business practices by giving preference to group transactions, they are of concern to the government." The singling out of keiretsu as a symbol of Japan's market barriers is regarded as having been a factor in reducing cross-holdings and long-term holdings.
(4) Cross-Holding in Keiretsu Groups
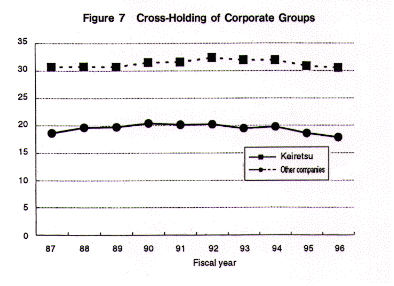
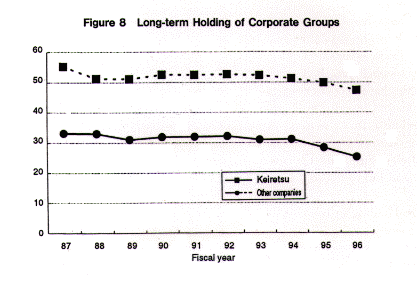
Given that the six corporate groups constitute a significant part of the economy in terms of both size and stature, and that they were discussed in the SII, attention has focused on the stock cross-holdings and long-term holdings within these keiretsu groups.
In fiscal 1996, the average stock cross-holding ratio of the six groups fell 0.34 percent but still remained at a high level of 30.55 percent (the non-keiretsu average is 17.83 percent). In addition, the cross-holding ratio within the corporate groups was 11.59 percent. The long-term holding ratio of 47.47 percent was much higher than the 25.31 percent among non-keiretsu companies.
However, the fact that the long-term holding ratio declined by more than the cross-holding ratio suggests that within keiretsu groups, a reduction in overall stock holdings is leading to the decline in long-term holdings (Figures 7 and 8).
Notes
- However, with the spate of stock-related scandals, recent discussions suggest that there may be overreaction. A typical argument expresses concern that if cross-holdings and long-term holdings collapse and stocks flow into the market, the market will deteriorate and stock prices will plunge.This is in marked contrast to the objective analysis in a June 1997 report by the U.S. Congressional Research Service entitled "Japanese Bank Ownership of Corporate Equities: Structure and Economic Effects": "As U.S. policymakers consider proposals for banking deregulation, Japan's experience may indicate some possible effects of allowing U.S. banks to expend their holdings of corporate equities and to engage more in the securities transactions."
- Securities reports filed by companies are required by MOF regulations to list the top ten major stockholders in descending order.
A company must report stockholdings under the categories of liquid assets & investments and other assets, except for individual stock issues valued on the balance sheet at less than 1/500 of the company's capital.
The stockholdings of banks cannot be ascertained from their securities reports, since under Article 119 banks are not required to submit a detailed table of their securities holdings.
Toyo Keizai Shinposha's major stockholder data lists the top 25 stockholders of companies because reports filed by companies are augmented by independent survey results. - For example, the market value of individual stocks of the top 50 companies was 130 billion yen at the end of 1997, and 1.2 trillion yen in March 1997. It has thus become quite unlikely that the controlling stake in a listed company could be altered through the stock market.
Hideaki Inoue
Research field
Copyright © 2016 NLI Research Institute. All rights reserved.