- NLI Research Institute >
- The Polarization of Japan's Stock Markets
The Polarization of Japan's Stock Markets
Shuichi Chizawa
Font size
- S
- M
- L
During fiscal 1996, Japan's stock markets moved within a fixed range until the Nikkei average plunged to the 17,000 range in November. In fiscal 1997 (beginning in April), although the Nikkei average recovered to the 20,000 range, the year-long uptrend since July 1995 had ended. Over the past five years, there have been a series of such up and down phases, each lasting from six months to one year (Figure 1).
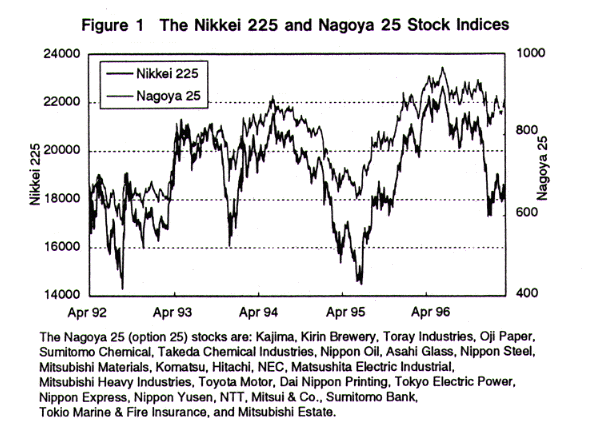
Meanwhile, the Nagoya major market index of 25 stocks has consistently outperformed the Nikkei 225, particularly in avoiding the severe plunge at the end of 1996.
This significant difference in the performance of blue chips versus the rest of the market points to a polarization in stock markets that has been characteristic of fiscal 1996. Particularly in the second half, while superior stocks in the automobile, electrical machinery, and precision instrument industries continually posted new highs, industries heavily impacted by deregulation such as banking and construction slumped.
For the 33 industry classifications on the Tokyo Stock Exchange, the top ten and worst ten in terms of return for fiscal 1996 are shown in Table 1.
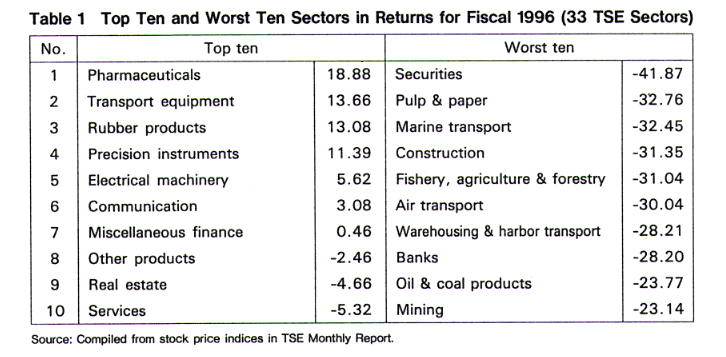
The six worst industries including securities and construction posted declines of over 30%. Banks, who had done well in past periods of low interest rates, also posted a decline of almost 30% due to their bad loan disposal problem and deregulation.
Top performers include pharmaceuticals, transport equipment, rubber products, precision instruments, and electrical machinery. Consumer sector stocks (food and retail), generally considered to be defensive stocks, were in the median range, showing that they were not necessarily immune to stock price declines.
In addition to large performance disparities across industries, fiscal 1996 was characterized by signs of change in the industrial structure, including the emergence of sectors not predicted by past patterns.
2. The Polarization Phenomenon
In addition to differences in business performance, the ongoing polarization of the stock market can be gleaned from other indications.
(1) Polarization Within Sectors
Returns were low in sectors that are now highly regulated and likely to be deregulated in the future, and high in sectors already exposed to intense competition in domestic and overseas markets. Below we look more closely at various sectors.
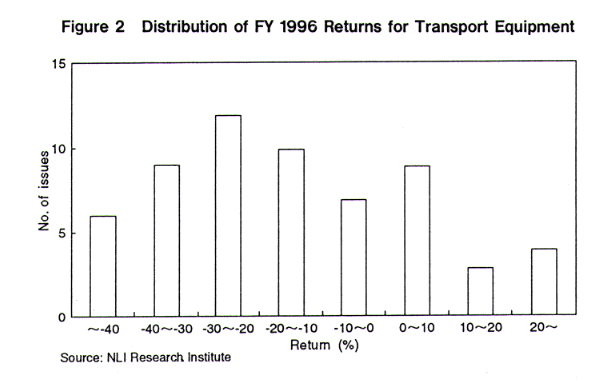
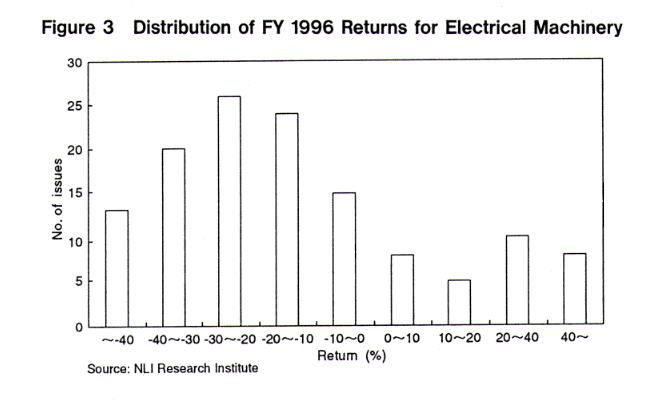
First, we look at two industries that are performing well−transport equipment and electrical machinery (TSE classifications). Histograms of industry returns for fiscal 1996 are shown in Figures 2 and 3. What becomes apparent is that the high industry returns are in fact attributable to a handful of companies in each industry, with the majority of stocks performing no better than in other industries. The strong impression of high returns in the automobile and electrical equipment industries derives from results being skewed by a few strong performers. In other words, the polarization we refer to is between a few blue chip stocks and the rest of the field.
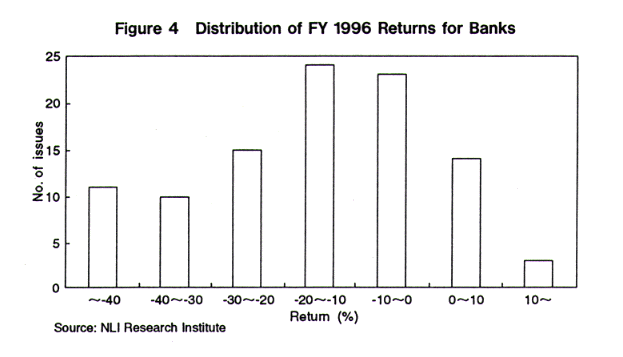
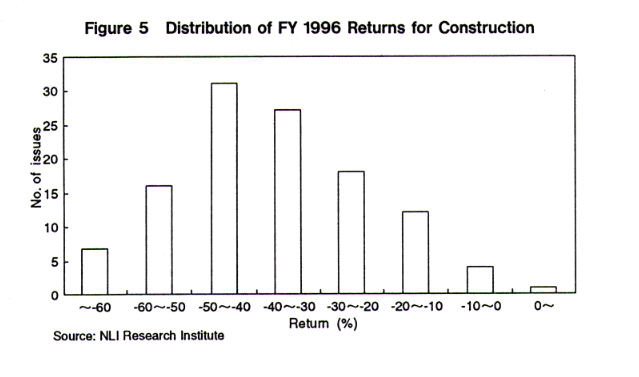
Next, we look at the distribution of returns for banking and construction sectors, who performed poorly in fiscal 1996 (Figures 4 and 5). While there are no stocks with high returns in either sector, we can also see that the distribution within each sector is as diverse as in the transport equipment and electrical machinery sectors. Thus regardless of sector, investors are being selective and clearly differentiating between winners and losers.
(2) Polarization and Investment Criteria
Since the stock selections of investors translate into differences in returns, what criteria do investors use to evaluate stocks? Let us look at PER (price/earnings ratio) and ROE (return on equity).
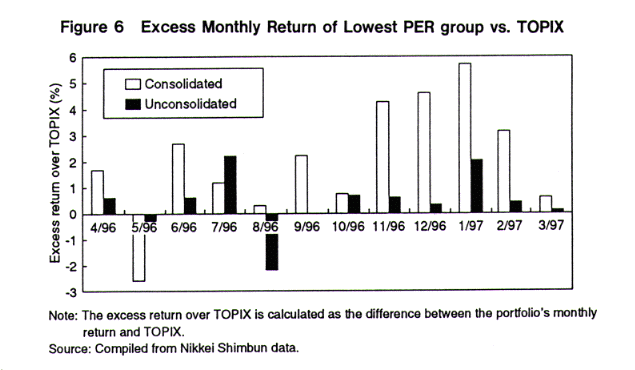
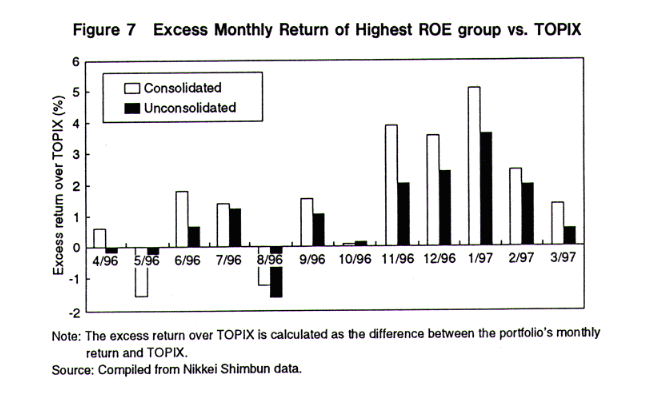
We ranked TSE first section stocks by PER and ROE, and compiled ten portfolios each month consisting of an equal number of issues. We then calculated the market price aggregate weighted returns of the portfolios each month, and compared them with the TOPIX monthly return. The PER and ROE values were calculated using consolidated and unconsolidated expected term profits.
For the lowest PER group and highest ROE group from fiscal 1996, the excess returns are shown in Figures 6 and 7.
In the second half of fiscal 1996, stocks with low PERs and high ROEs on a consolidated basis outperformed the TOPIX by far. This clearly shows that investors' criteria shifted from an unconsolidated to consolidated settlement basis, favoring companies that pursued globalization and were superior in group strength.
(3) Path to Polarization
In the late 1980s, while the overall market rose continuously, many individual stocks did not perform well. A characteristic of this period was the widespread cyclical pattern of buying stocks that lagged behind. Thus PER and PBR (price to book ratio) were effective criteria in selecting stocks. Leaving aside whether investors actually used PER and PBR for investment decisions, the relative effectiveness of these yardsticks was evident at least superficially. However, their inordinately high values compared to international levels reduced their explanatory power with regard to absolute stock price levels. Since these investment criteria were relative at best, foreigners claimed that Japanese investors did not have any reasonable investment criteria.
After the asset bubble collapsed in 1990, the stock market acquired the characteristic of a trading market in which performance was influenced by overall market indices rather than the selection of individual stocks. As stock prices headed continuously downward and volatility increased, arbitrated transactions using futures and options increased, and the market focused on indices rather than on individual stocks.
Considering that plunging stock prices were accompanied by falling interest rates, some stock prices declined to reasonable levels. Nevertheless, a situation persisted in which price formation did not accurately reflect the fundamentals of individual stocks. One factor was the phenomenon of the tail (futures transactions) wagging the dog (underlying assets). But the prime factor was that companies hobbled by the collapse of the asset bubble and restructuring troubled assets did not provide adequate information to investors.
Never has management leadership been more critical nor reflected more clearly in corporate performance and stock prices. In fact, even in the same industry, there are disparities in performance and growth potential depending on a company's management. Moreover, the market responds sensitively to management's stance toward stockholders and the quality of disclosure. In this way, polarization has occurred against the backdrop of corporate restructuring following the bubble's collapse, wherein previously concealed differences in responsiveness began to be vividly reflected in corporate performance.
3. The Nifty-Fifty Era in the U.S.
The U.S. stock market experienced a similar polarization during the early 1970s known as the "Nifty-Fifty." Here we briefly consider its relevance to the Tokyo Stock Exchange.
While the U.S. economy prospered during the "Golden 60s" era, inflation mounted and international competitiveness declined as Germany and Japan emerged and the economic burden of the Vietnam war grew. The stock market boom ended in the early 1970s, triggered by the failure of the international investment trust IOS.
A noteworthy change in the market during this period was the shift from individual to institutional investors. In the late 1960s, mutual funds called "go-go funds" flourished. After these aggressively managed funds were culled out in the bear market from 1969 to 1970, major investment trust banks managing pension funds became the main players. But institutional investors continued to pursue high performance in actively managed funds with assets collected from clients.
Against this backdrop, from the second half of 1970 to 1973, the market became polarized between a few strong performing stocks and the majority of poor performers. The Nifty-Fifty were characterized by an apparent immunity to economic conditions, marketing strength, and market dominance. In addition, many of these companies had high export ratios and benefited from the weak dollar as globalization advanced.
At the time, the prevailing investment style was to invest in growth stocks. This approach was premised on the belief that as long as companies pursued profit growth, stock prices would rise. It was also thought that since managing large-scale funds total market value was large, they had no choice but to invest in stocks that were liquid. Institutional investors later learned that this liquidity was illusory because when they tried to sell stocks that all the other institutional investors had bought, there were no buyers.
When the Nifty-Fifty continued to rise for over two years, even value investors who followed Graham and Dodd's could no longer resist either pressure from clients or the risk of not buying these stocks. Performance comparisons with rivals or with benchmarks suffered if portfolios did not include these stellar performers. Fund managers thus deviated substantially from their rational investment criteria. What happened was a "fallacy of composition."
However, the Nifty-Fifty was bound to falter sooner or later, and finally did as interest rates rose at an accelerating pace and the first oil shock hit in October 1973. Resource stocks then replaced growth stocks as the market's main focus. The U.S. stock market subsequently moved within a fixed range for the next decade until the Reagan era.
4. The Future of Japan's Polarized Market−Comparison with the U.S.
Several similarities can be pointed out between the Nifty-Fifty in the U.S. and the polarization occurring in Japan. First, both occur at the end of a long-term expansion, when differences in corporate performance are clearest. This is because while most companies enjoy higher earnings during an expansion (a rising tide lifts all boats), differences in competitiveness and performance become apparent during a recession. Thus the selection of stocks becomes critical when investing.
In Japan today, investors must pay attention not only to corporate performance (flow variables), but to stock variables as well (failed assets, loans, etc.) as a result of the collapse of the asset bubble. While the number of bankruptcies among listed companies has been low in the past compared to the U.S., investors can no longer ignore the risk of default. As a result, investors tend to lean more strongly toward good stocks.
The second similarity is the growing presence of institutional investors. Deregulation of pension fund management has increased the amount of funds entrusted to investment advisory companies, use of specialized management, and so on. Institutions that manage pension funds are evaluated against a benchmark, and competition between management institutions has intensified. Although ratings agencies claim fund performance must be evaluated over at least a three-year period, the fact is that clients focus on short-term quarterly results. This puts pressure on fund managers to include in their portfolios blue chip stocks that have no problems in their business or performance because in the short term, at least, there is the risk lost opportunity by not buying these stocks. As mentioned previously, this type of investment behavior tends to cause the "fallacy of composition."
Third is globalization. Applying the concept of globalization to the U.S. is not as strange as it may first sound. After World War Two, the U.S. economy prospered as the only major economy not damaged by war. But the dollar's value then plunged until the U.S. was forced to intervene and protect the dollar in 1971. The dollar's devaluation prompted U.S. companies to turn their attention overseas and also helped them build new markets.
In Japan, the yen recently returned to 120 yen to the dollar after peaking at 80 yen. Exporters who had to relentlessly cut costs under the strong yen have recovered their competitiveness as a result of the weaker yen. These companies have significantly improved their performance in part also due to strong demand from the U.S. In addition, globalization refers not simply to producing in local markets or expanding exports, but to bringing markets and management closer to global standards. Some companies will decline, of course, but many new companies will emerge to take advantage of new opportunities.
The U.S. and Japanese cases also have differences. First is a difference in investment styles. The Nifty-Fifty were growth stocks with high PERs based on their long-term growth prospects. On the other hand, Japan's blue chip stocks have reported earnings growth that justify their rising stock prices, and are still discounted in terms of consolidated PER. But while their PER is lower than other domestic stocks and their prices are likely to continue rising, they are not necessarily inexpensive compared to good U.S. and European stocks in the same industry. For example, Toyota's aggregate market value exceeded the combined market values of the Big Three in the U.S. (April 1997). This suggests the need to reevaluate the investment criteria for blue chip stocks.
The second difference is that the polarization in Japan reflects not only the relative superiority of a small number of stocks, but the relative inferiority of stocks in regulated industries. The superior stocks will simply approach the market average, and unless structural reform progresses in the industries that are relatively inferior, this polarization will continue.
Third is the practice of cross-shareholdings. Unrealized gains from stockholdings decreased substantially due to plunging stock prices after the bubble collapsed and repeated losses. Companies have thus begun reducing cross-shareholdings that prove not to be beneficial. Particularly in industries undergoing deregulation, companies will rapidly reduce their business ties and cross-shareholdings.
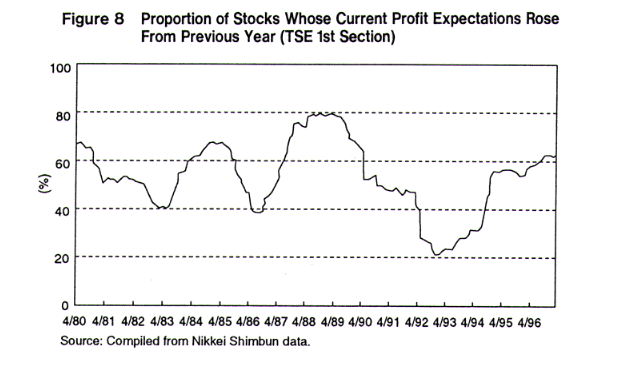
The Nifty-Fifty stocks met their demise with the plunge in growth stocks. As for the polarization of stocks in Japan, since stock selection will continue to be based on corporate performance, some industries and companies lagging behind in restructuring will have low stock prices. On the other hand, it is unlikely that the few internationally superior stocks will continue to lead the market. As Figure 8 shows, business results have already hit bottom and entered an expansionary undertone. The key to a lasting bull market will lie in whether the steady growth among exporters will spread to other sectors, and whether undervalued stocks will be reevaluated to reflect improved business results.
Shuichi Chizawa
Research field
レポート紹介
-
研究領域
-
経済
-
金融・為替
-
資産運用・資産形成
-
年金
-
社会保障制度
-
保険
-
不動産
-
経営・ビジネス
-
暮らし
-
ジェロントロジー(高齢社会総合研究)
-
医療・介護・健康・ヘルスケア
-
政策提言
-
-
注目テーマ・キーワード
-
統計・指標・重要イベント
-
媒体
- アクセスランキング


