


- NLI Research Institute >
- Asset management・Asset building >
- Investors Trading Trends in Japanese Stock Market:An Analysis for October 2025
NEW
Column
11/11/2025
Investors Trading Trends in Japanese Stock Market:An Analysis for October 2025
Financial Research Department Chizuru Morishita


Font size
- S
- M
- L
Summary
・The Nikkei 225 rose for the seventh consecutive month, reaching the 50,000 level for the first time in history.
・Foreign investors were the largest net buyers in October, with a total net purchase of 1.32 trillion yen.
・Trust banks recorded a net purchase of 801.4 billion yen, turning net buyers for the first time in six months.
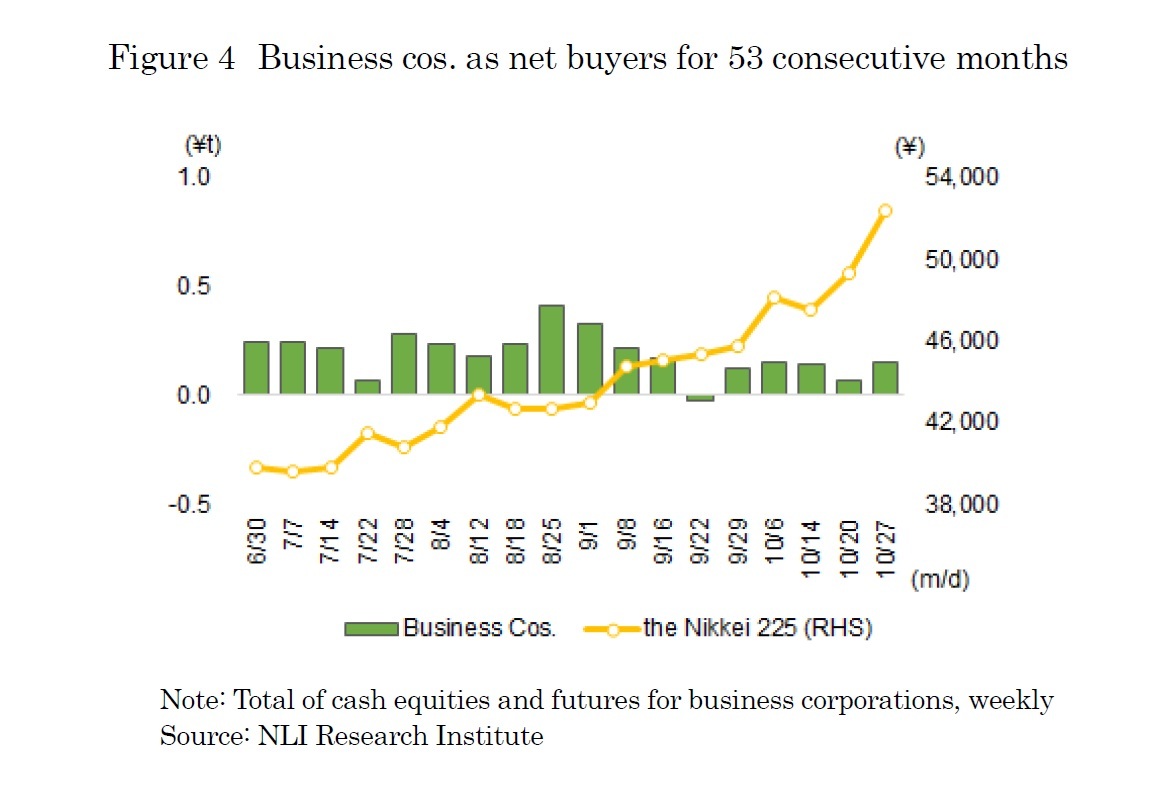
・Business corporations posted a net purchase of 637.4 billion yen, marking their 53rd consecutive month of net buying.
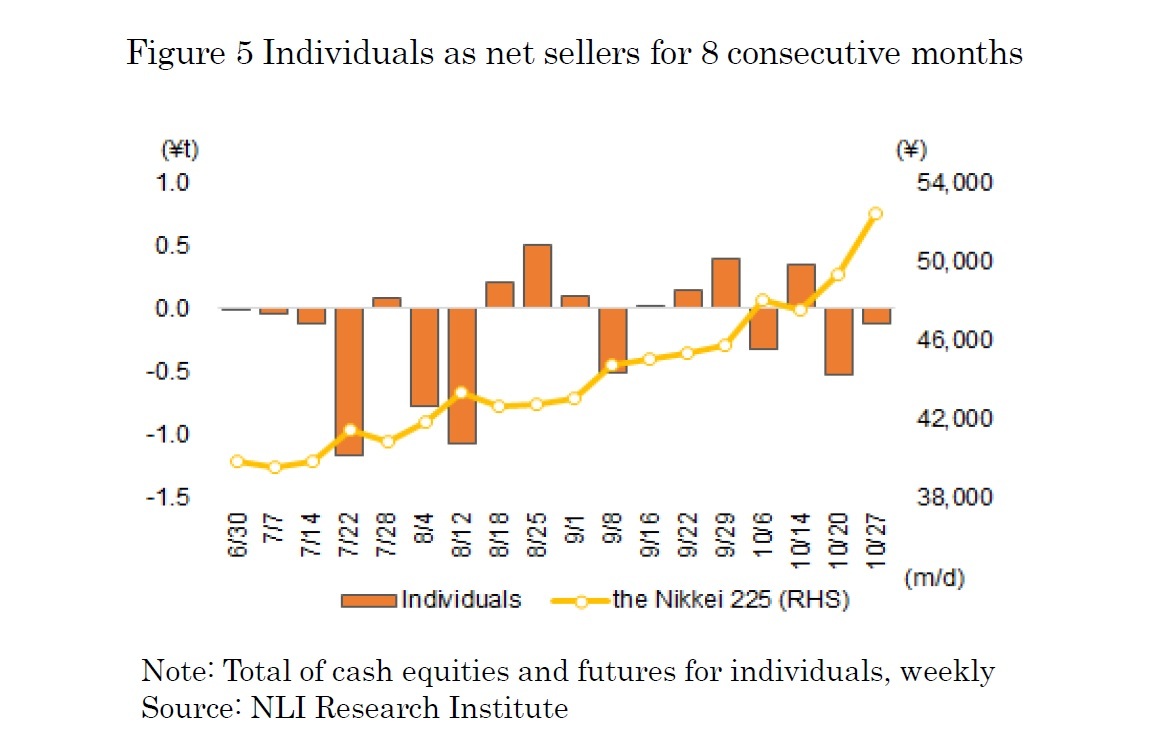
・Individuals were net sellers by 216.3 billion yen, recording their eighth consecutive month of net selling.
・Foreign investors were the largest net buyers in October, with a total net purchase of 1.32 trillion yen.
・Trust banks recorded a net purchase of 801.4 billion yen, turning net buyers for the first time in six months.
・Business corporations posted a net purchase of 637.4 billion yen, marking their 53rd consecutive month of net buying.
・Individuals were net sellers by 216.3 billion yen, recording their eighth consecutive month of net selling.
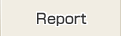
In October 2025, the Nikkei 225 rose for the seventh consecutive month, reaching the 50,000 level for the first time in history. Early in the month, the market started on a soft note due to concerns over a potential U.S. government shutdown, with the index closing in the 44,000 range on the 2nd. Supported by expectations of U.S. rate cuts and a weaker yen, the upward trend strengthened. After Ms. Takaichi’s victory in the LDP presidential election on the 4th, optimism pushed the market higher, and the Nikkei surged to 47,944 on the 6th. In mid-October, the index briefly declined due to the Komeito Party’s exit from the coalition and renewed concerns over U.S. regional banks. However, expectations of a coalition between the LDP and Nippon Ishin, along with gains in generative AI-related stocks, helped the market resume its rise. Following the launch of the new Takaichi Cabinet on the 21st, expectations for expansionary fiscal policy and gains in U.S. high-tech stocks accelerated the rally. On the 27th, the Nikkei closed at 50,512, marking its first-ever finish above 50,000, and ended the month at 52,411. By investor type, foreign investors, trust banks and business corporations were net buyers, while individuals were net sellers (as shown in Figure 1).
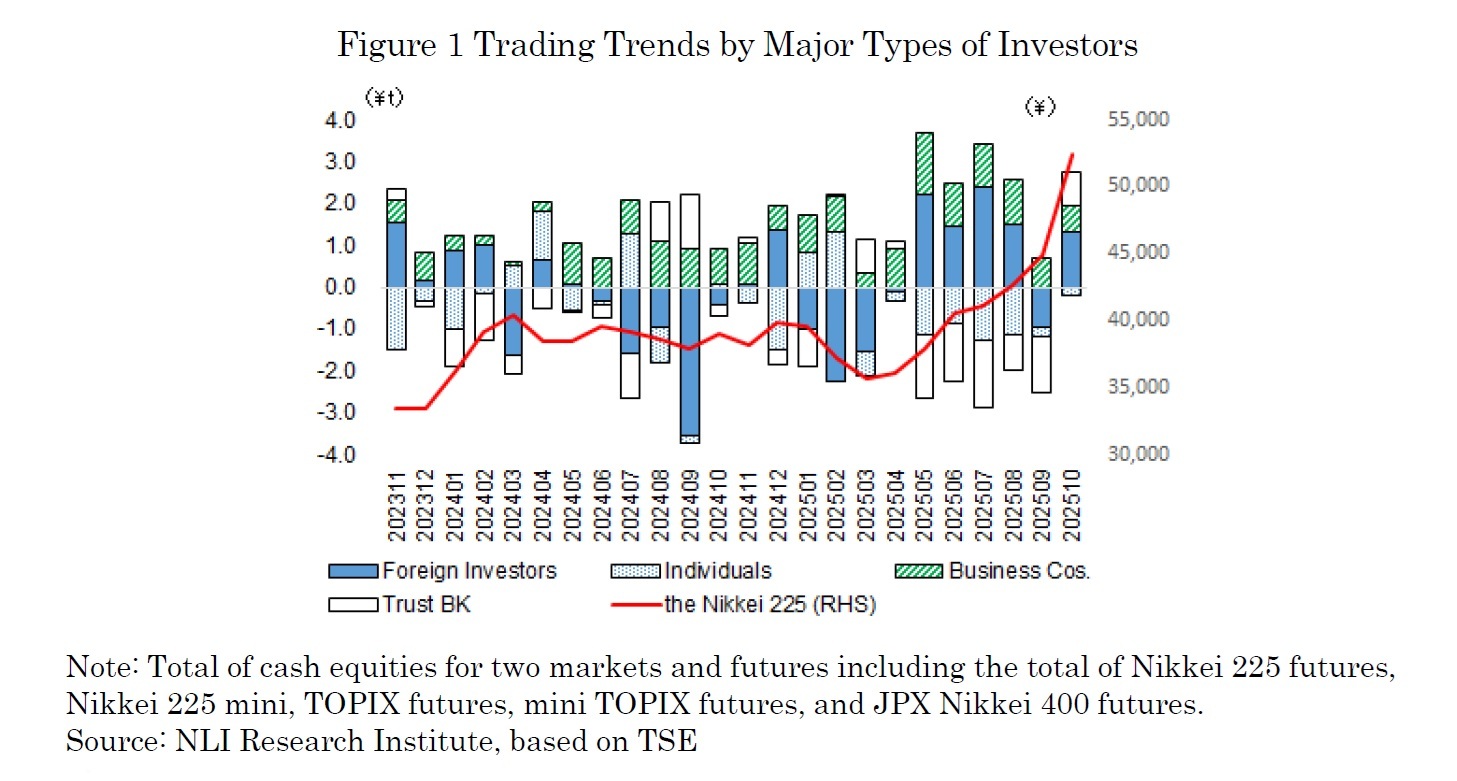
The trading by type of investors in October 2025 (September 29 to October 31) shows that foreign investors were the largest net buyers, with a total net purchase of 1.32 trillion yen in cash equities and futures (as shown in Figure 2). On a weekly basis, they recorded substantial net buying of 1.18 trillion yen in the second week (October 6 to 10), during which the Nikkei rose by about 2,300 yen. In contrast, in the fifth week (October 27 to 31), they posted a modest net sales of 188.8 billion yen in cash equities and futures. Although the Nikkei exceeded the 50,000 level at the beginning of that week and rose by roughly 3,100 yen over the week, foreign investors were net sellers, mainly through profit-taking in futures.

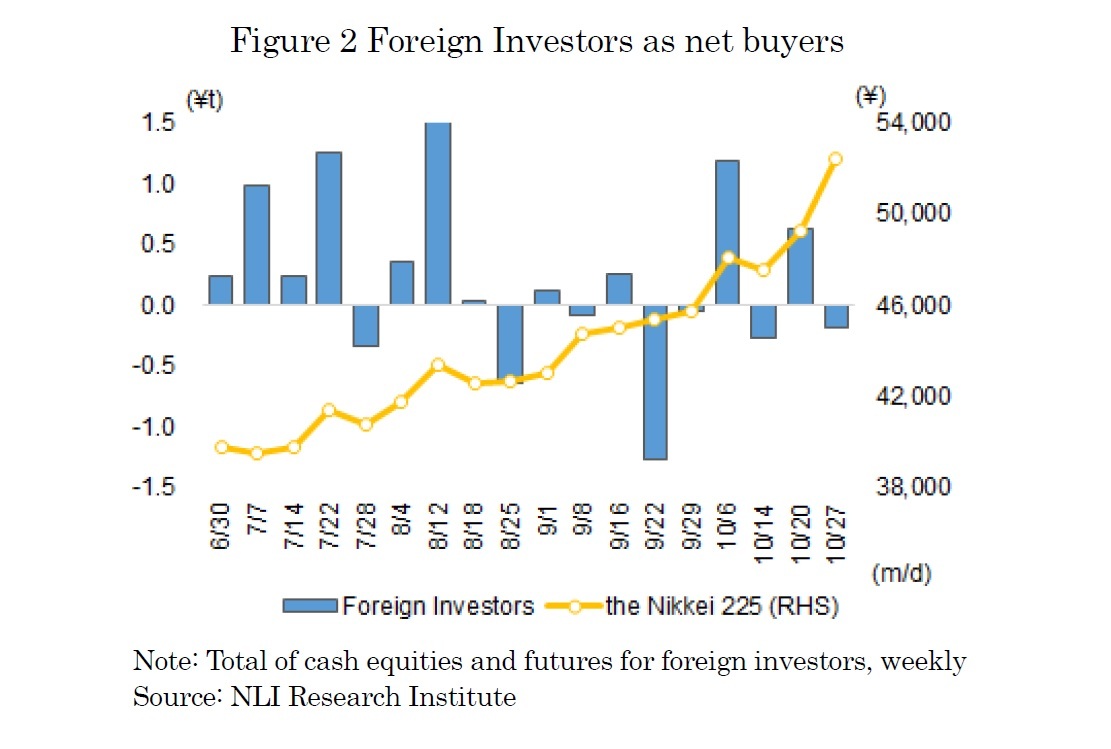
In October, trust banks were also net buyers, with a total net purchase of 801.4 billion yen in cash equities and futures. While trust banks had been net sellers for five consecutive months since May, they turned to net buying for the first time in six months as the index rose sharply during the month (as shown in Figure 3).

Furthermore, business corporations were also net buyers in October, with a total net purchase of 637.4 billion yen in cash equities and futures. Supported by continued share buybacks, business corporations recorded their 53rd consecutive month of net buying (as shown in Figure 4).

On the other hand, individuals were net sellers, with a total net sale of 216.3 billion yen in cash equities and futures (as shown in Figure 5). While major investor groups were net buyers and the Nikkei reached new record highs, profit-taking dominated among individuals, resulting in their eighth consecutive month of net selling. However, the scale of net selling has been shrinking, declining from over 1 trillion yen per month earlier in the year to around 200 billion yen in September and October, suggesting that individuals’ aggressive selling stance has gradually eased.

This report includes data from various sources and NLI Research Institute does not guarantee the accuracy and reliability. In addition, this report is intended only for providing information, and the opinions and forecasts are not intended to make or break any contracts.

03-3512-1855
Copyright © 2016 NLI Research Institute. All rights reserved.