1.The July–September Quarter of 2024 Achieved 0.9% Positive Growth on an Annualized Basis
In the July–September quarter of 2024, Japan’s real GDP grew by 0.2% from the previous quarter (0.9% on an annualized basis), marking the second consecutive quarter of positive growth. While private residential investment (-0.1% from the previous quarter) and capital investment (-0.2% from the previous quarter) showed slight declines, private consumption increased by a strong 0.9%, supported by an increase in disposable income resulting from income and resident tax cuts. With the downward pressure from rising prices, summer consumption faced further constraints from temporary train suspensions, travel cancellations, and factory shutdowns caused by typhoon activity and the Nankai Trough Earthquake Advisory. However, the income and resident tax cuts implemented since June have significantly boosted household disposable income, supporting consumption.
Exports grew by only 0.4% from the previous quarter, falling short of the 2.1% growth in imports. As a result, net external demand contributed negatively to growth (-0.4%). Nevertheless, increases in both private demand and public demand led to a positive contribution from domestic demand (+0.6%), outweighing the drag from external demand.
(Exports Continue a Modest Upward Trend.)
The global trade volume turned positive year-on-year after entering 2024 and has gradually gained momentum, while Japan’s exports have remained flat.
Looking ahead at overseas economies, which will influence the outlook for Japanese exports, the real GDP growth rate of the U.S. is expected to slow from 2.9% in 2023 to 2.7% in 2024, but still well above the potential growth rate. However, cumulative monetary tightening, along with President-elect Trump’s pledged tariff hikes and inflationary pressures from the deportation of illegal immigrants, is expected to slow U.S. growth to 1.8% in 2025 and 1.4% in 2026. In the euro area, which recorded a low growth of 0.4% in 2023, inflation stabilization is anticipated to lead to a gradual recovery, with growth improving to 0.8% in 2024 and 1.4% in both 2025 and 2026. However, growth is expected to remain moderate compared to the sharp contraction during the COVID-19 crisis. In China, real GDP growth accelerated from 3.0% in 2022 to 5.2% in 2023 following the end of the zero-COVID-19 policy. However, growth is forecasted to decelerate to 4.7% in 2024, 4.2% in 2025, and 4.0% in 2026, reflecting a sluggish real estate market and slow improvements in employment and income conditions. Overall, while the global economy is expected to recover modestly through 2026, growth is likely to remain subdued.
On a brighter note, the global recovery in demand for IT-related goods continues. Global semiconductor sales, which had been declining year-on-year since the summer of 2019 and bottomed out in the spring of 2023, have recently achieved growth of over 20% year-on-year.
Although low global economic growth limits the potential for a sharp acceleration in export growth, Japan’s exports are expected to show a gradual recovery, particularly exports of IT-related goods. In GDP statistics, exports of goods and services are forecasted to grow moderately by 1.5% year-on-year in FY2024 and by 2.9% in both FY2025 and FY2026.
(Summer Bonuses Significantly Boosted Wages.)
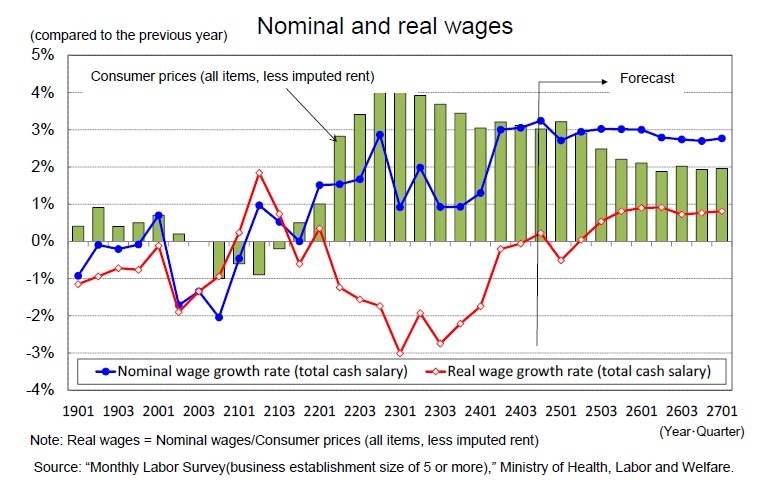
Total cash earnings (per capita) grew by a robust 3.1% year-on-year in the July–September quarter of 2024, following a 3.0% increase in the April–June quarter. This reflects the results of the 2024 spring labor negotiations, which saw the highest wage increases in 33 years, as well as a significant rise in summer bonuses, boosting total cash earnings.
According to the Ministry of Health, Labour, and Welfare’s November 7th announcement, summer bonuses in 2024 increased by 2.3% year-on-year, marking the third consecutive year of growth. However, this figure represents the average for workers at establishments that paid bonuses. When all establishments are included, the average bonus per worker grew by a substantial 5.7% year-on-year. This was due to an increase in the percentage of establishments paying bonuses, from 65.9% in 2023 to 73.0% in 2024, as well as a rise in the proportion of workers employed at such establishments from 80.0% to 84.3%. Many small- and medium-sized enterprises likely decided to pay bonuses amid improved corporate earnings and severe labor shortages.
The real wage growth rate, calculated by adjusting nominal wages for consumer price inflation, turned positive for the first time in two years and three months in June 2024 (+1.1% year-on-year), followed by a 0.3% increase in July. However, these positive results were mainly driven by significant increases in special cash earnings (bonuses). In August (-0.8% year-on-year) and September (-0.1%), when fewer bonuses were paid, real wages turned negative again. Real wage growth is expected to turn positive again in October, primarily due to a slowdown in electricity and city gas price inflation under the "Emergency Assistance for Overcoming Severe Summer Heat" program, and in December, driven by strong year-end bonuses. However, after the program ends, inflation is likely to rise again, delaying sustained and stable real wage growth until after the start of FY2025.
(The Rate of Increase in Spring Wages in 2025 is Expected to Remain in the 5% Range for the Second Consecutive Year.)
The rate of wage increase in the 2024 spring labor negotiations was 5.33% (Ministry of Health, Labour and Welfare, "Spring Wage Demands and Compensation of Major Private Corporations"), the highest in 33 years. In 2025, the labor market is expected to remain tight, with the effective job openings-to-applicants ratio staying well above 1.0 and the unemployment rate hovering at the mid-2% range. In addition, ordinary income (seasonally adjusted) in the Financial Statements Statistics of Corporations by Industry continues to set new records, while consumer price inflation remains elevated.
In its basic policy announced on October 18, RENGO stated that it would again demand wage increases of 5% or more (including regular salary increases) in 2025, and that small- and medium-sized labor unions would actively seek additional increases to address wage disparities. Based on this context, the current forecast assumes that the rate of spring wage increase for 2025 would be 5.20%, maintaining a high level in the 5% range for the second consecutive year.
Nominal wages are forecasted to grow by approximately 3% year-on-year. However, given the volatility of consumer prices due to policy changes, real wages are expected to alternate between positive and negative growth in the short term. Sustained and stable positive real wage growth is not anticipated until the July–September quarter of 2025, when consumer price inflation (excluding imputed rent of owner-occupied houses), currently around 3%, is expected to decelerate to the mid-2% range.
2.The Real Growth Rate is Forecasted at 0.4% in FY2024,
2.The Real Growth Rate is Forecasted at 0.4% in FY2024, 1.1% in FY2025, and 1.2% in FY2026
(Growth Rate Expected to Remain Around 1% Annually.)
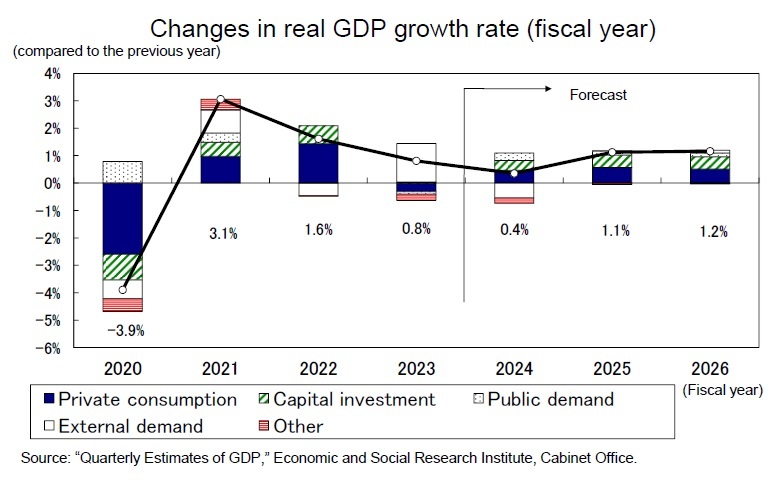
Real GDP in the July–September quarter of 2024 recorded positive growth for the second consecutive quarter, primarily driven by strong growth in private consumption supported by the effects of income and resident tax cuts. Looking ahead, while the effects of the tax cuts are expected to wane, recovery in real wages and a resulting increase in real disposable income are anticipated to underpin consumption. Although capital investment remains stagnant with ups and downs, it is expected to continue its recovery trend, supported by high corporate earnings. Starting in the second half of FY2024, growth driven by domestic private demand is forecasted to slightly exceed the potential growth rate, around the upper-zero-percent range, while maintaining an annual rate of approximately 1%.
The real GDP growth rate is forecasted to be 0.4% in FY2024, 1.1% in FY2025, and 1.2% in FY2026. Downside risks include a potential sharp slowdown in the global economy caused by President-elect Trump’s economic policies and a decline in consumption stemming from reduced real incomes due to rising prices.
(Personal Consumption Dependent on Disposable Income.)
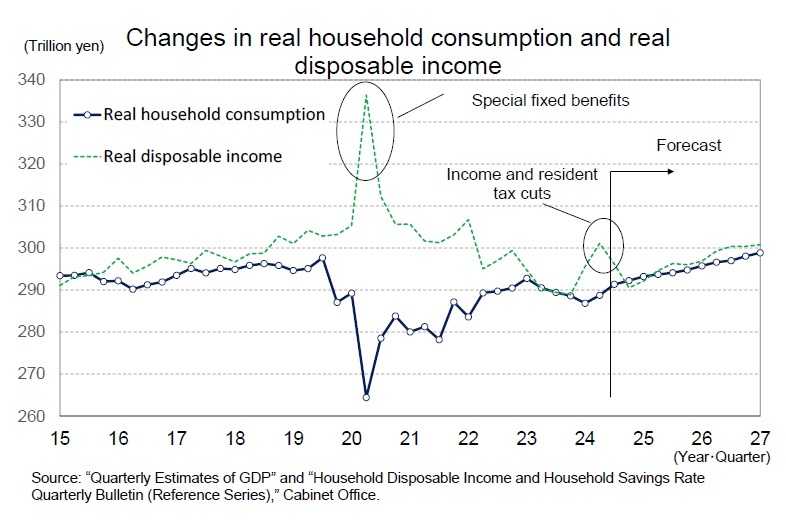
The household savings rate surged to 21.1% in the April–June quarter of 2020, reflecting a sharp drop in consumption caused by the state of emergency declaration in April 2020 and a significant increase in disposable income due to special fixed benefits. Subsequently, the savings rate declined as a result of recovery in consumption driven by the easing of behavioral restrictions and the impact of rising prices, remaining close to 0% throughout 2023. After entering 2024, disposable income increased significantly due to benefits for low-income households and income and resident tax cuts. However, consumption growth remained moderate, leading to an increase in the savings rate up to 3.7% in the April–June quarter of 2024. Although the household savings rate for the July–September quarter has not yet been published, considering the strong consumption growth, it is likely to have fallen significantly to around 1%, a level comparable to that in the pre-COVID-19 period.
Thus, future consumption will largely depend on the fundamental trend of real disposable income, excluding temporary factors. After a temporary decline due to the fading effects of income and resident tax cuts, real disposable income is expected to remain solid, primarily supported by high nominal wage growth and an increase in real employee compensation caused by a slowdown in inflation. Private consumption, which declined by 0.6% year-on-year in FY2023 for the first time in three years, is forecasted to increase moderately by 0.9% in FY2024, 1.1% in FY2025, and 1.0% in FY2026. In FY2024, growth in real employee compensation will remain modest, but income and resident tax cuts will boost disposable income. From FY2025 onward, while the effects of tax cuts will dissipate, stronger growth in real employee compensation will contribute to an increase in real disposable income.
(Labor Shortages Restrain the Pace of Capital Investment Recovery.)
Capital investment grew by only 0.3% year-on-year in FY2023 but is forecasted to recover gradually, with an expected growth of 2.2% in FY2024, 2.7% in FY2025, and 2.6% in FY2026.
According to the September 2024 Bank of Japan Tankan Survey, capital investment plans for FY2024 (covering all sizes and industries, including software and R&D investment, but excluding land investment) were revised downward by 0.5% from the June survey. However, the year-on-year growth rate remained high at 10.1%.
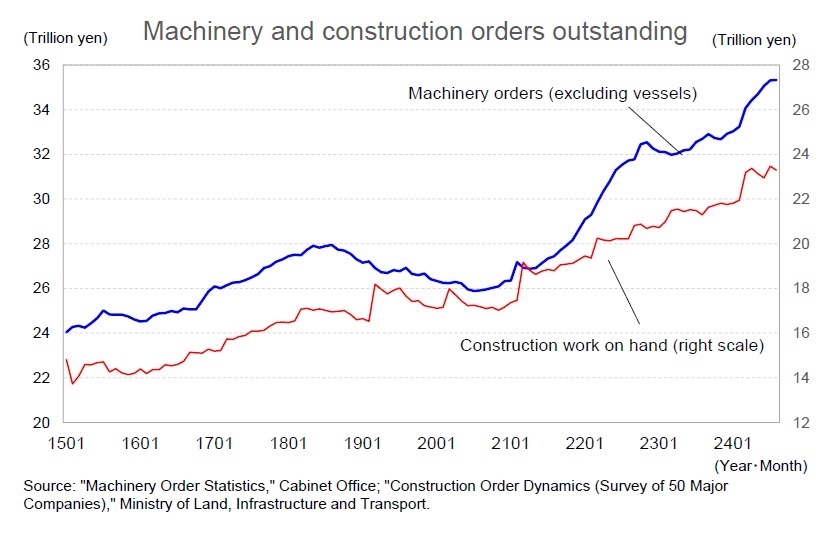
Within capital investment, machinery orders, a leading indicator of machinery investment, and construction work orders, a leading indicator of construction investment, have remained flat. However, the backlog of machinery and construction orders has continued to increase. While the high order backlog suggests future expansion of capital investment, it may also reflect supply-side constraints such as labor shortages, which have delayed machinery production and construction progress.
Capital investment is expected to continue its recovery, supported by strong corporate earnings. Key drivers include labor-saving investments to address labor shortages, IT-related investments for digitalization, and construction investments associated with the expansion of e-commerce. However, the pace of increase is likely to remain moderate due to supply-side constraints, such as labor shortages, which are acting as a limiting factor in capital investment.
レポートについてお問い合わせ
(取材・講演依頼)