


- NLI Research Institute >
- Economics >
- Japan's Economic Outlook for FY 2020–2022
17/11/2020
Japan's Economic Outlook for FY 2020–2022
Economic Research Department Executive Research Fellow Taro Saito


Font size
- S
- M
- L
1. In the July–September quarter of 2020, the economy grew at an annualized rate of 21.4%.
In the July–September quarter of 2020, real GDP grew 5.0% (21.4% per annum) from the previous quarter, the first positive growth in 4 quarters. The growth rate was the largest since 1980 in the GDP statistics.
In addition to a 4.7% quarter-on-quarter increase in private consumption due to the lifting of the declaration of a state of emergency and the effects of special flat-rate benefits, exports rose 7.0% from the previous quarter as global economic activities resumed, while imports fell 9.8% from the previous quarter. As a result, external demand contributed 2.9% (12.2% per annum) to the GDP growth rate.
On the other hand, against the backdrop of rapid deterioration in corporate earnings and heightened uncertainty about the future, capital investment declined 3.4% from the previous quarter, down for the 2nd consecutive quarter. Housing investment declined 7.9% from the previous quarter, down for the 4th consecutive quarter, reflecting a drop in the number of housing starts under the state of emergency.
In the July–September quarter of 2020, economic activity resumed at home and abroad, leading to strong positive growth, but this was just less than 60% of the decline in the April–June quarter, which saw record negative growth. The Japanese economy was hit by the consumption tax hike before the impact of the novel coronavirus infection became apparent. Compared to the most recent peak in July–September 2019, real GDP in July–September 2020 was down 5.9% and private consumption was down 7.2%. The pace of economic normalization is slow.
(Hard-hit face-to-face service industry)
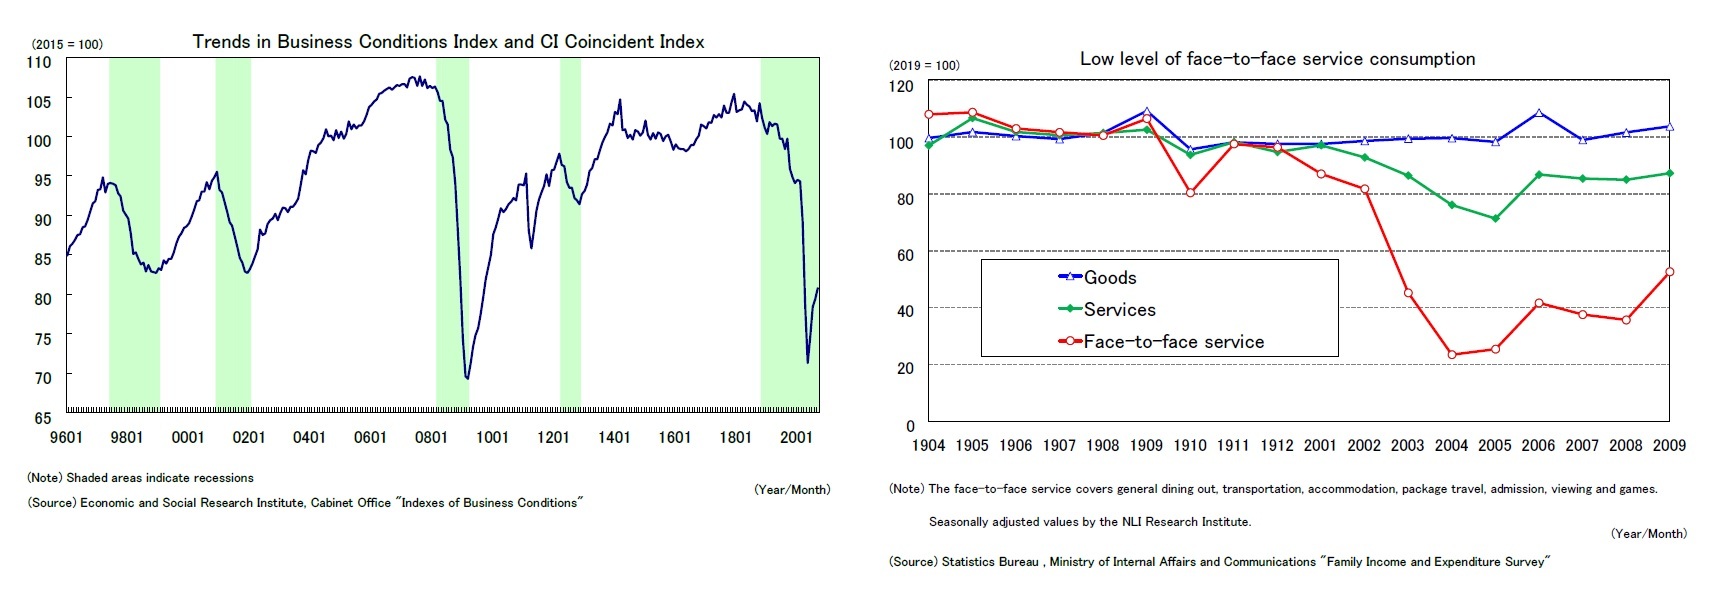
The economy bottomed out in May 2020 after the declaration of a state of emergency was lifted. The CI coincident index of the business conditions index rose for 4 consecutive months from June to September 2020, and the basic assessment of the business conditions index "worsening" (CI concordance index), which had continued since August 2019, was revised upward to "halting to fall" in August 2020.
Personal consumption, which hit a record low under the state of emergency, has rebounded since May, but remains well below pre-coronavirus levels. Looking at the trends in real consumer spending by type of "Family Income and Expenditure Survey (Statistics Bureau, Ministry of Internal Affairs and Communications)," spending on goods has already exceeded the average pre-coronavirus level in 2019 due to the expansion of stay-at home consumption and the effects of special fixed benefits. On the other hand, the decline in service consumption at the time of the declaration of the state of emergency was very large and the subsequent recovery was weak. In particular, consumption of face-to-face services (general dining out, transportation, accommodation fees, package tour fees, admission, viewing, and game fees) dropped to about 20% of pre-coronavirus levels in April and May 2020, and remained at about 50% in the latest (September 2020).
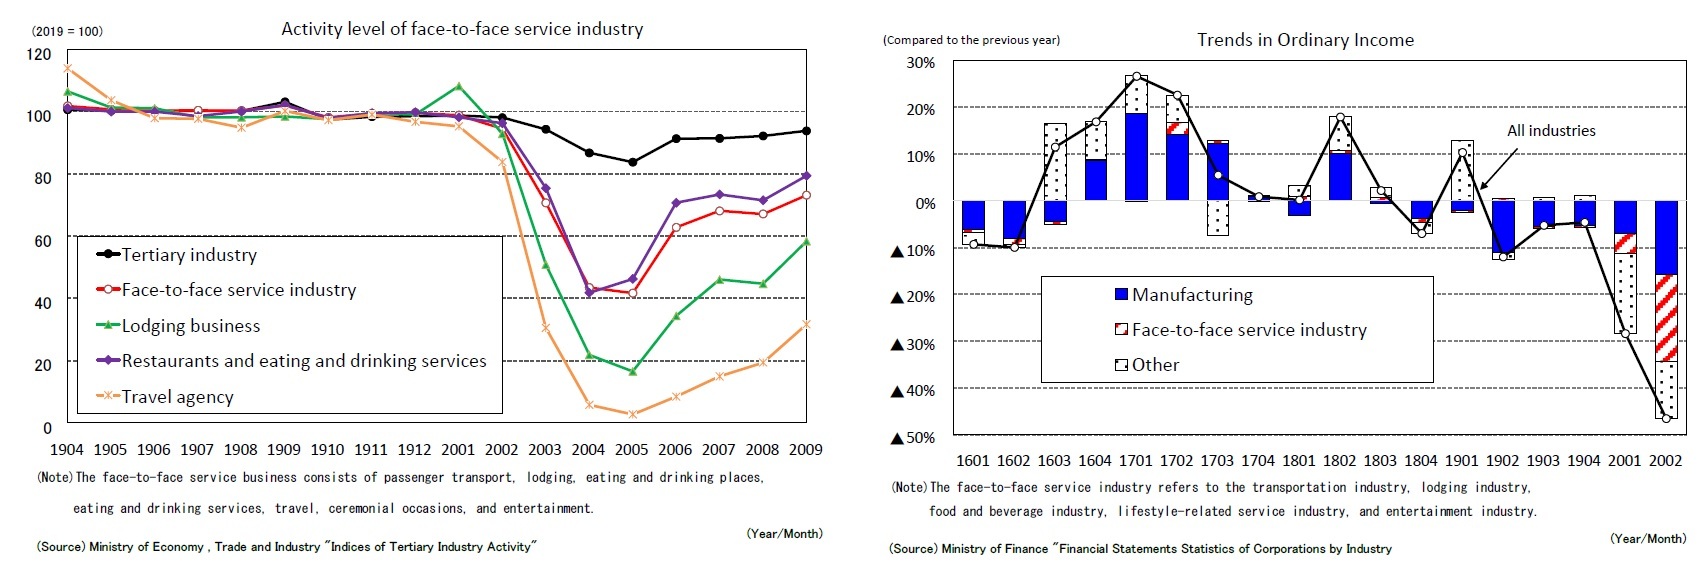
The decline in consumption of face-to-face services has directly brought a decline in the level of activities and profits of face-to-face services industry. The "Index of Tertiary Industry Activity" of the Ministry of Economy, Trade and Industry declined sharply from March to May 2020, but recovered after June. However, the activity level of face-to-face service industries such as passenger transport, lodging, and entertainment remained significantly below that of the pre-coronavirus level (average for 2019 years). 1
According to the "Financial Statements Statistics of Corporations by Industry" by the Ministry of Finance, in the April–June quarter of 2020, ordinary profit (excluding financial and insurance businesses) decreased by 46.6% from the previous year. Of this, the face-to-face service industry contributed 18.5%. In 2019, face-to-face services accounted for only about 8% of all industries' ordinary profit. However, because transport, lodging, food and beverage services, living-related services, and entertainment were all in the red, their contribution to the decline in profits in all industries in the April–June quarter of 2020 was about 40%.
According to the "Financial Statements Statistics of Corporations by Industry" by the Ministry of Finance, in the April–June quarter of 2020, ordinary profit (excluding financial and insurance businesses) decreased by 46.6% from the previous year. Of this, the face-to-face service industry contributed 18.5%. In 2019, face-to-face services accounted for only about 8% of all industries' ordinary profit. However, because transport, lodging, food and beverage services, living-related services, and entertainment were all in the red, their contribution to the decline in profits in all industries in the April–June quarter of 2020 was about 40%.

The amount of discount support for the "Go To Travel," which started in July, was about 208.7 billion yen, and the number of people staying overnight was about 39.76 million people by the end of October. (The total number of guests in 2019 was 595.92 million.) In addition, the "Go To Eat," which started in October, has consumed almost all of the budget in just over 1 month, and the use of the points will stimulate restaurant demand hereafter. The “Go To” campaign is scheduled to expire at the end of January 2021 and in the middle of February. It is highly likely that the 3rd supplementary budget for FY 2020, which will be formulated in the future, will include an extension of the “Go To” campaign, and it is expected that these measures will continue to contribute to boosting the consumption of face-to-face services.
 At the same time, however, as the number of people infected with the novel coronavirus has increased recently, there is a risk that people will once again increasingly refrain from going out and will reduce contact opportunities.
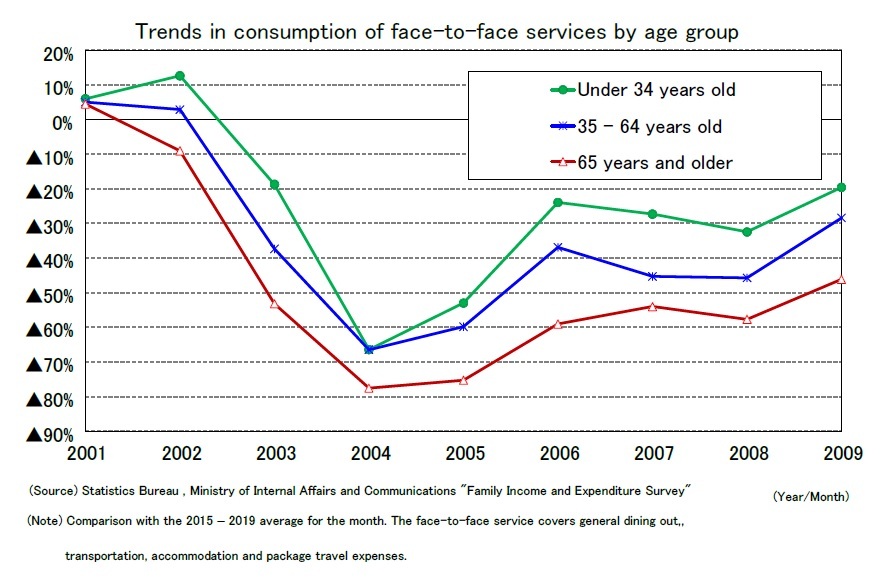
Looking at trends in consumption of face-to-face services by age group of household heads, the decline in consumption by elderly people aged 65 and over was greater than that of other age groups, and the pace of recovery was slow thereafter. The level of consumption of face-to-face services among young people aged 34 or younger declined from the average between 2015 and 2019 by about 70% in April 2020 to about 20% in September 2020, while that of people aged 65 or older remained about 50% lower. This may be because elderly people are more likely to avoid going out and personal contact because they are at higher risk of developing severe cases of novel coronavirus infection. As elderly households account for nearly 40% of total consumption, if concerns about infectious diseases intensify, face-to-face service consumption, particularly among elderly people, will fall again, increasing the possibility of a delay in the overall recovery of consumption
1 The scope of face-to-face services varies according to industry and product categories.
 (Tough employment situation)
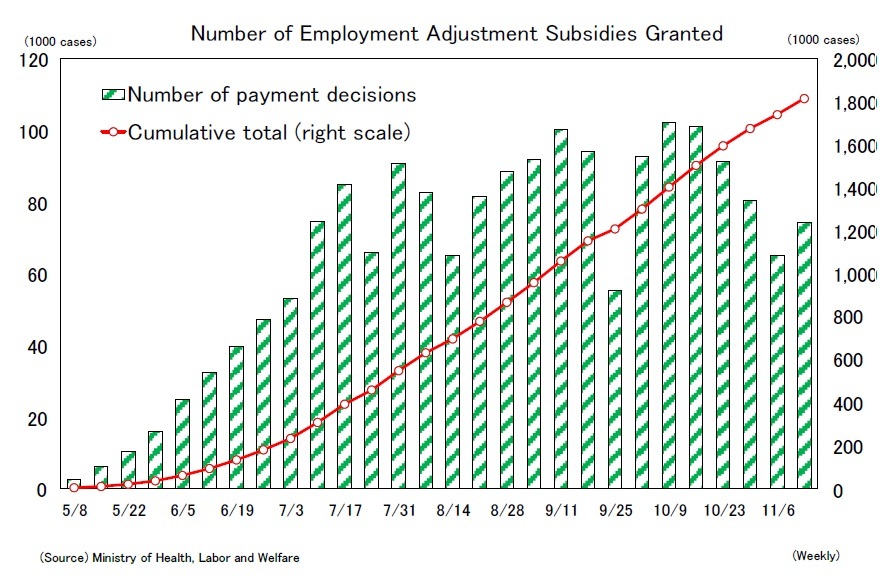
The employment situation remains severe. The ratio of job openings to job seekers, which reflects the supply-demand balance in the labor market, declined from 1.63 in April 2019 to 1.03 in September 2020, and the unemployment rate rose from 2.2% in December 2019 to 3.0% in September 2020. The increase in the unemployment rate remains limited in response to the sharp decline in economic activity because many of the people who lost their jobs due to the suspension of economic activity were only those who took time off from work, which is a breakdown of the employed persons, due to the expansion of employment adjustment subsidies.2
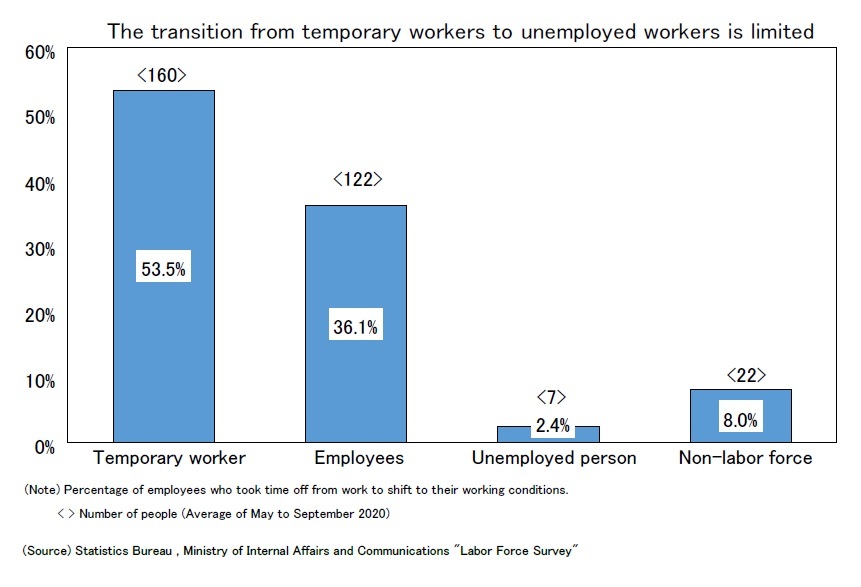
In April 2020,when the declaration of a state of emergency was issued, the number of employed persons not at work reached a record high of 5.97 million (up 4.2 million from the previous year), but then gradually decreased from May, reaching 1.97 million (up 350,000 from the previous year) in September. Among those on leave, 53.5% remained on leave, 36.1% shifted to employed, 2.4% to unemployed, and 8.0% to the non-working population (Average from May to September 2020).3 At present, it can be evaluated that the expansion of employment adjustment subsidies has played a role in stopping the increase in the number of unemployed.
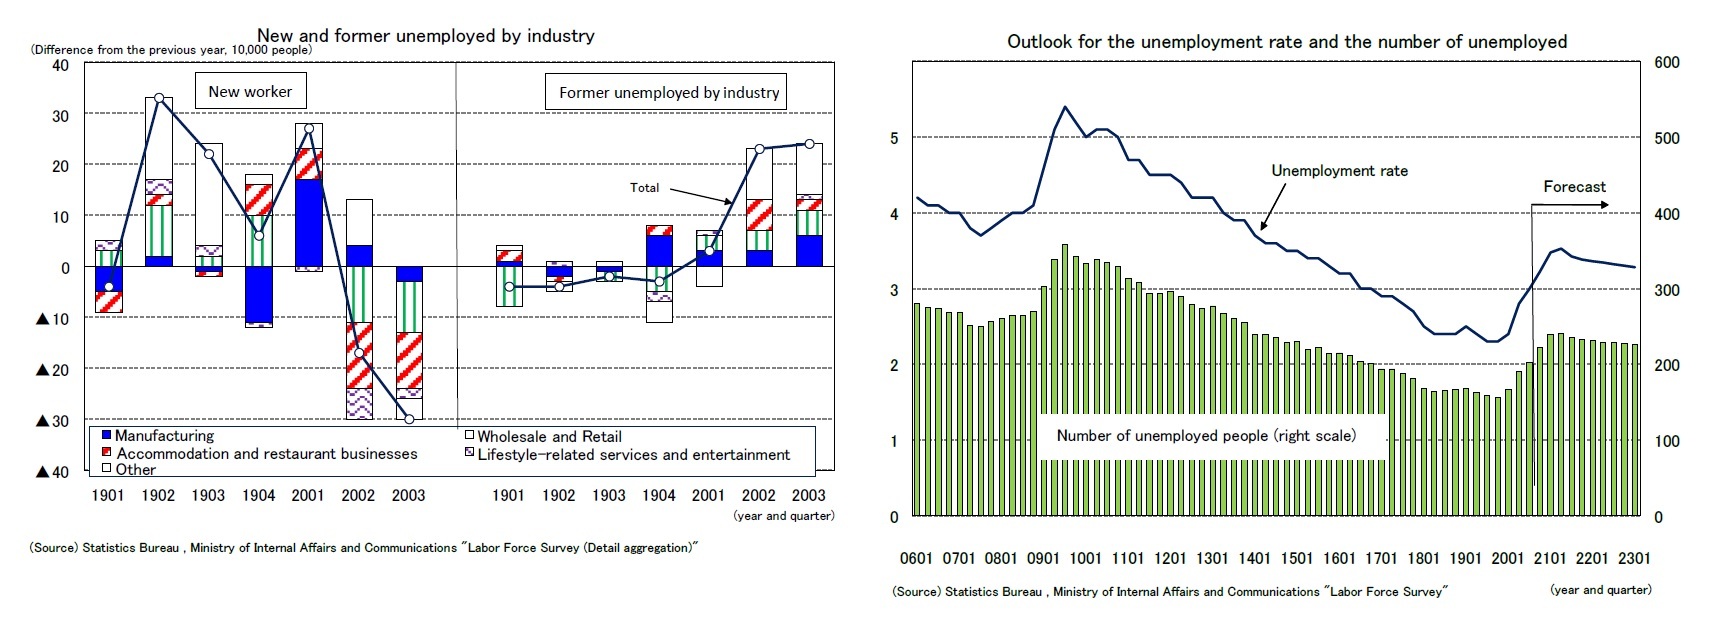
 However, it is feared that maintaining employment without returning to the original level of economic activity will reduce the number of new hires, especially new graduates. In fact, while the number of newly unemployed people (former unemployed by industry) has been kept to a certain level, the number of newly employed people in the July–September quarter of 2020 decreased by 300,000 from the previous year (in the April–June period, the figure stood at minus 170,000). The pace of decrease has accelerated in the wholesale and retail industries as well as the lodging and eating and drinking industries.
Although the economy has already bottomed out, the unemployment rate is already a lagging indicator of the economy, and there is a possibility that the improvement in the employment situation will be delayed by the retention of employment in companies backed by the expansion of employment adjustment subsidies, which will hinder future job creation. The number of unemployed increased from the most recent bottom of 2019 (October–December) of 1.56 million to 2.02 million in 2020 (July–September), but will rise to 2.41 million in 2021 (April–June). From the end of FY 2020 to the beginning of FY 2021, the unemployment rate will rise to 3.5%, and then gradually decline after the beginning of FY 2021. However, the pace of decline remains moderate, and the unemployment rate is expected to remain high at 3.3% at the end of FY 2022.
The current forecast assumes that the special measures for employment adjustment subsidies, which are scheduled to end at the end of December 2020, will continue after 2021, while the amount and rate of subsidies will be gradually reduced.

The current forecast assumes that the special measures for employment adjustment subsidies, which are scheduled to end at the end of December 2020, will continue after 2021, while the amount and rate of subsidies will be gradually reduced.
2 Among those who have a job but do not work at all during the Survey Week, those who are paid or are to receive salaries and wages as an employer, and those who are self-employed and have had their own business and have not been absent from work for 30 days.
3 A person who has completed at least one hour of work with income during the survey week

03-3512-1836
Social media account
レポート紹介
-
研究領域
-
経済
-
金融・為替
-
資産運用・資産形成
-
年金
-
社会保障制度
-
保険
-
不動産
-
経営・ビジネス
-
暮らし
-
ジェロントロジー(高齢社会総合研究)
-
医療・介護・健康・ヘルスケア
-
政策提言
-
-
注目テーマ・キーワード
-
統計・指標・重要イベント
-
媒体
- アクセスランキング
Copyright © 2016 NLI Research Institute. All rights reserved.