In this section, it is discussed that the poverty rate and the current situation of the working poor in South Korea by utilizing OECD data and precedent studies to explain the background of the implementation of the EITC.
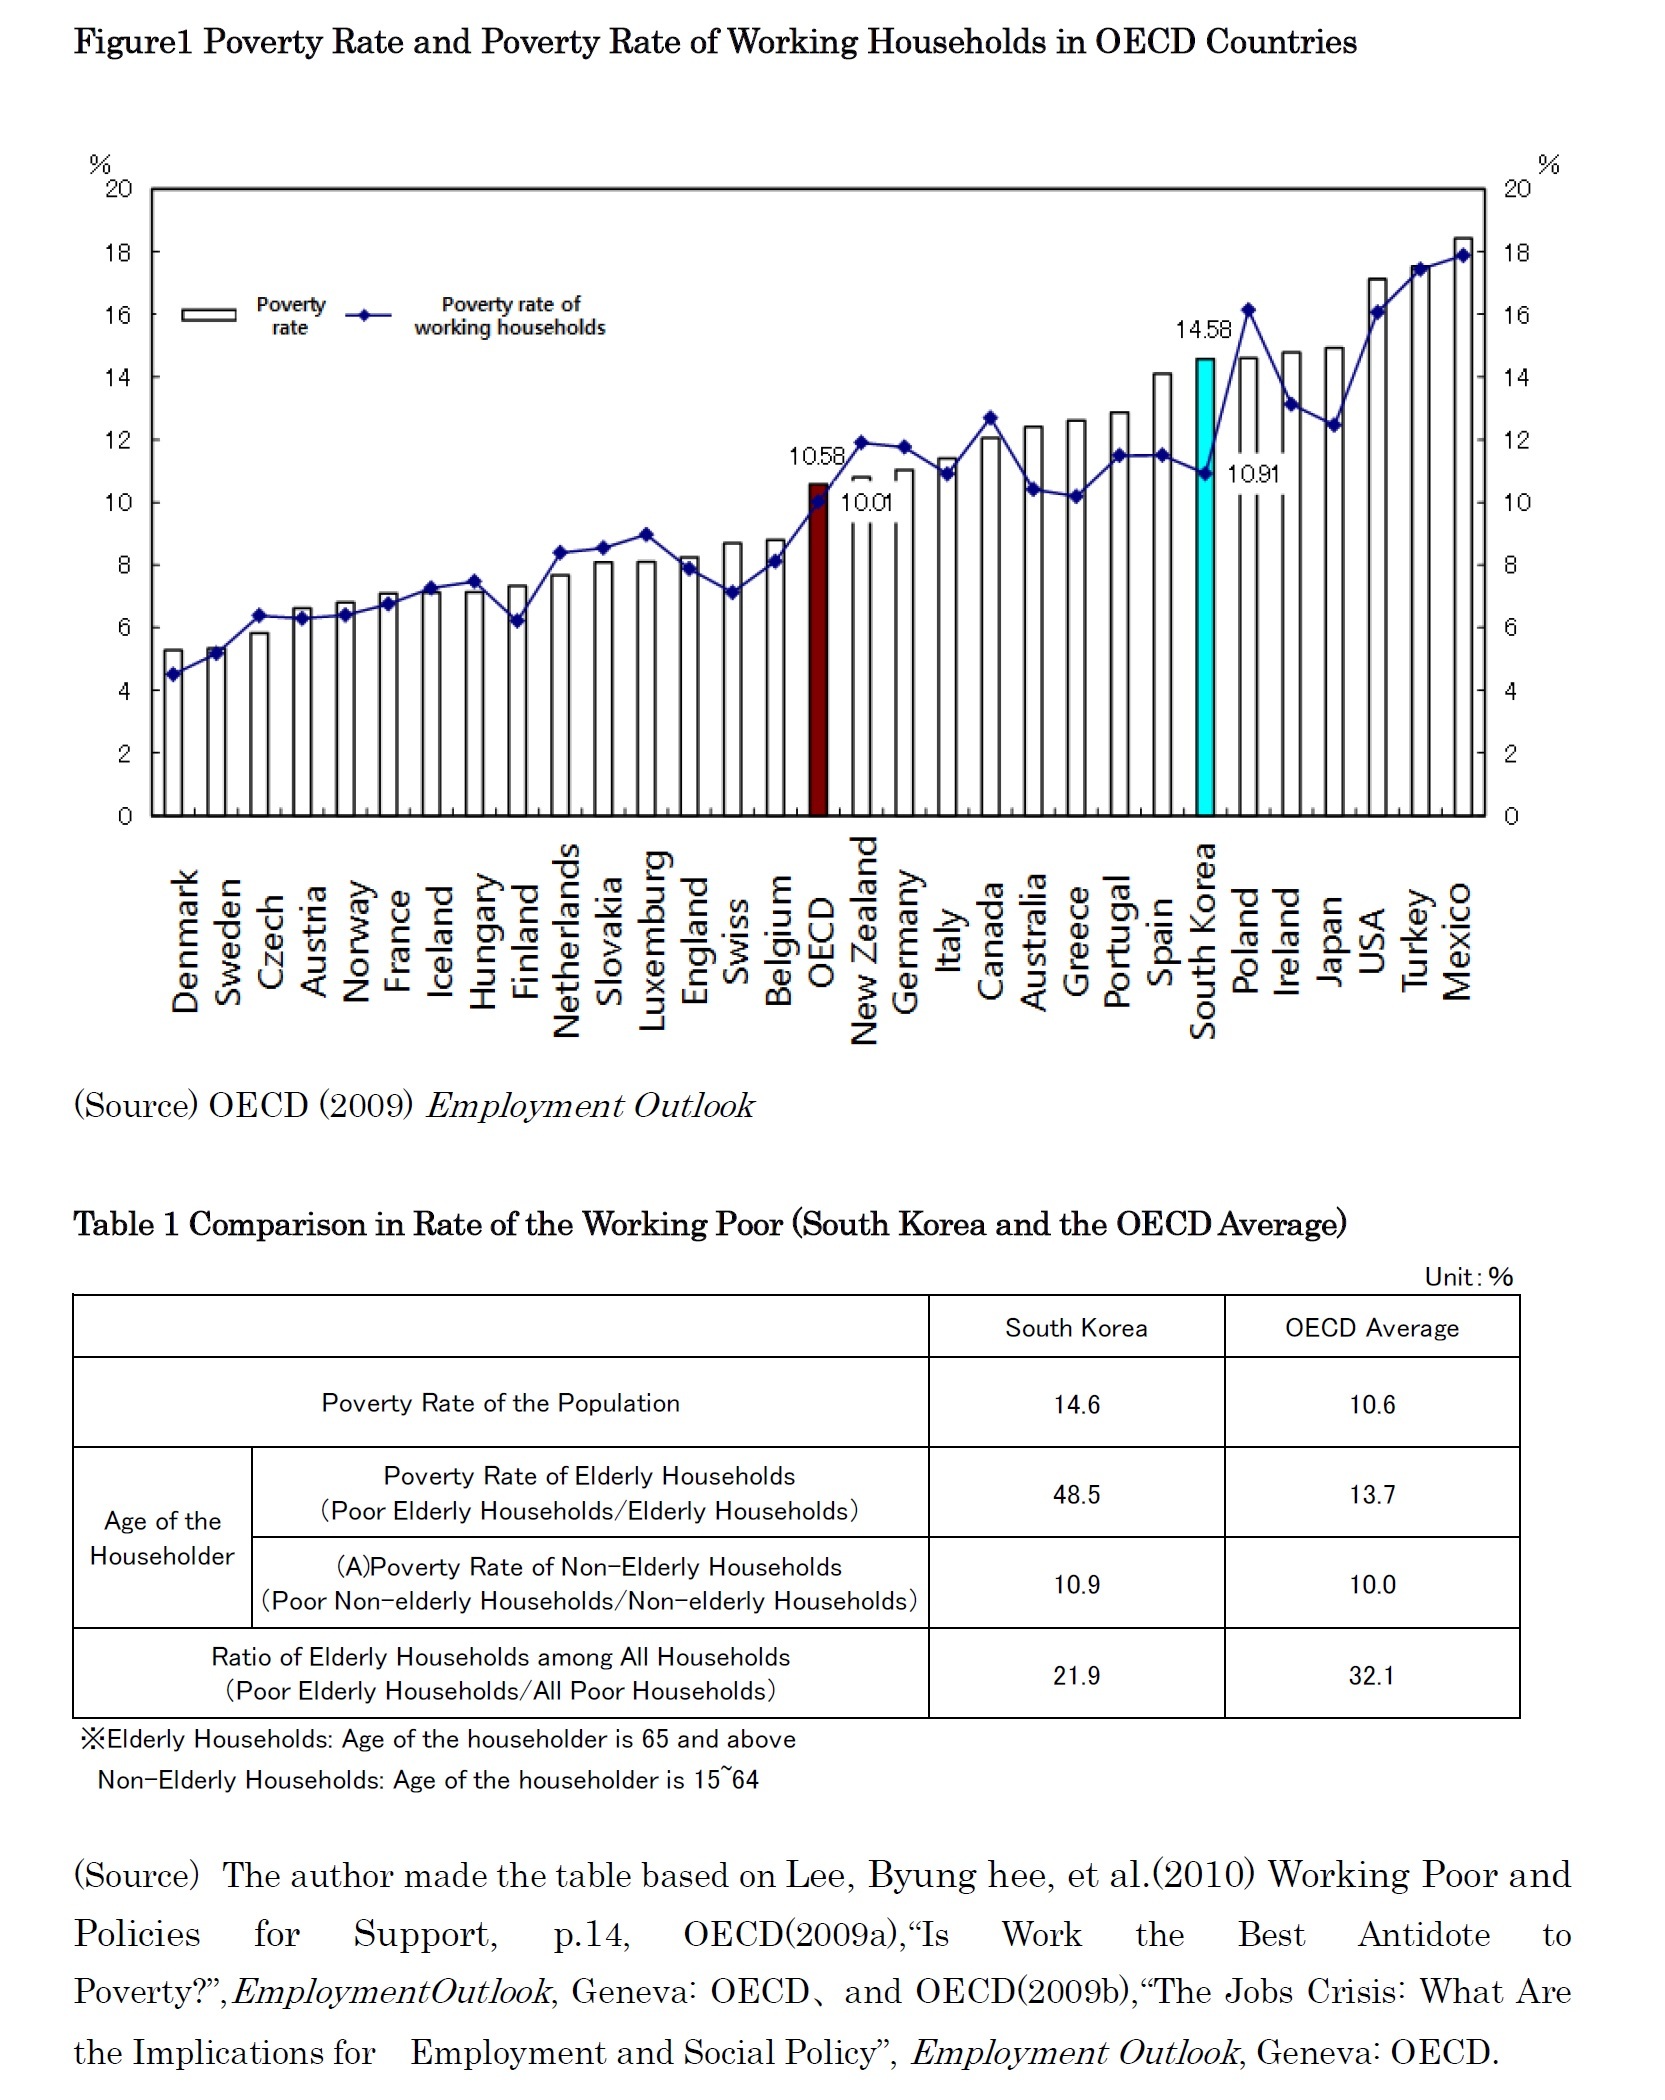
Figure 1 illustrates relative poverty rates among OECD countries and relative poverty rates
3 among the working households. Relative poverty rate of South Korea in the mid-2000s (14.6%) highly outweighs the OECD average (10.6%).
To understand the current situation of the working poor in South Korea, Byung-hee Lee, et al. (2010) classifies household in two groups, ‘elderly household’ and ‘non-elderly household’ based on OECD data, and compares South Korean data with the OECD average. As a result, ‘poverty rate of elderly household’ is 48.5% and it exceeds the average OECD of 13.7%. The high poverty rate of elderly household in South Korea is attributed to immature public pension system in terms of payments. Meanwhile, poverty rate of the non-elderly household is 10.9%, and there is a relatively small difference with the OECD average of 10.1%. However, ‘elderly household’ accounts for 21.9% of all poor households and the figure is smaller than 32.1% of OECD; labor problem of working households in South Korea seems to be bigger (Table 1).
The high economically active household ratio that consists of the all poor households in South Korea is attributable to relatively low population aging rate, low rate of participation to labor market of young generation based on employment mismatch, high ratio of non-regular workers with relatively low income level among employees, South Korean government’s insufficient countermeasures for social security for economically active households, and so on.
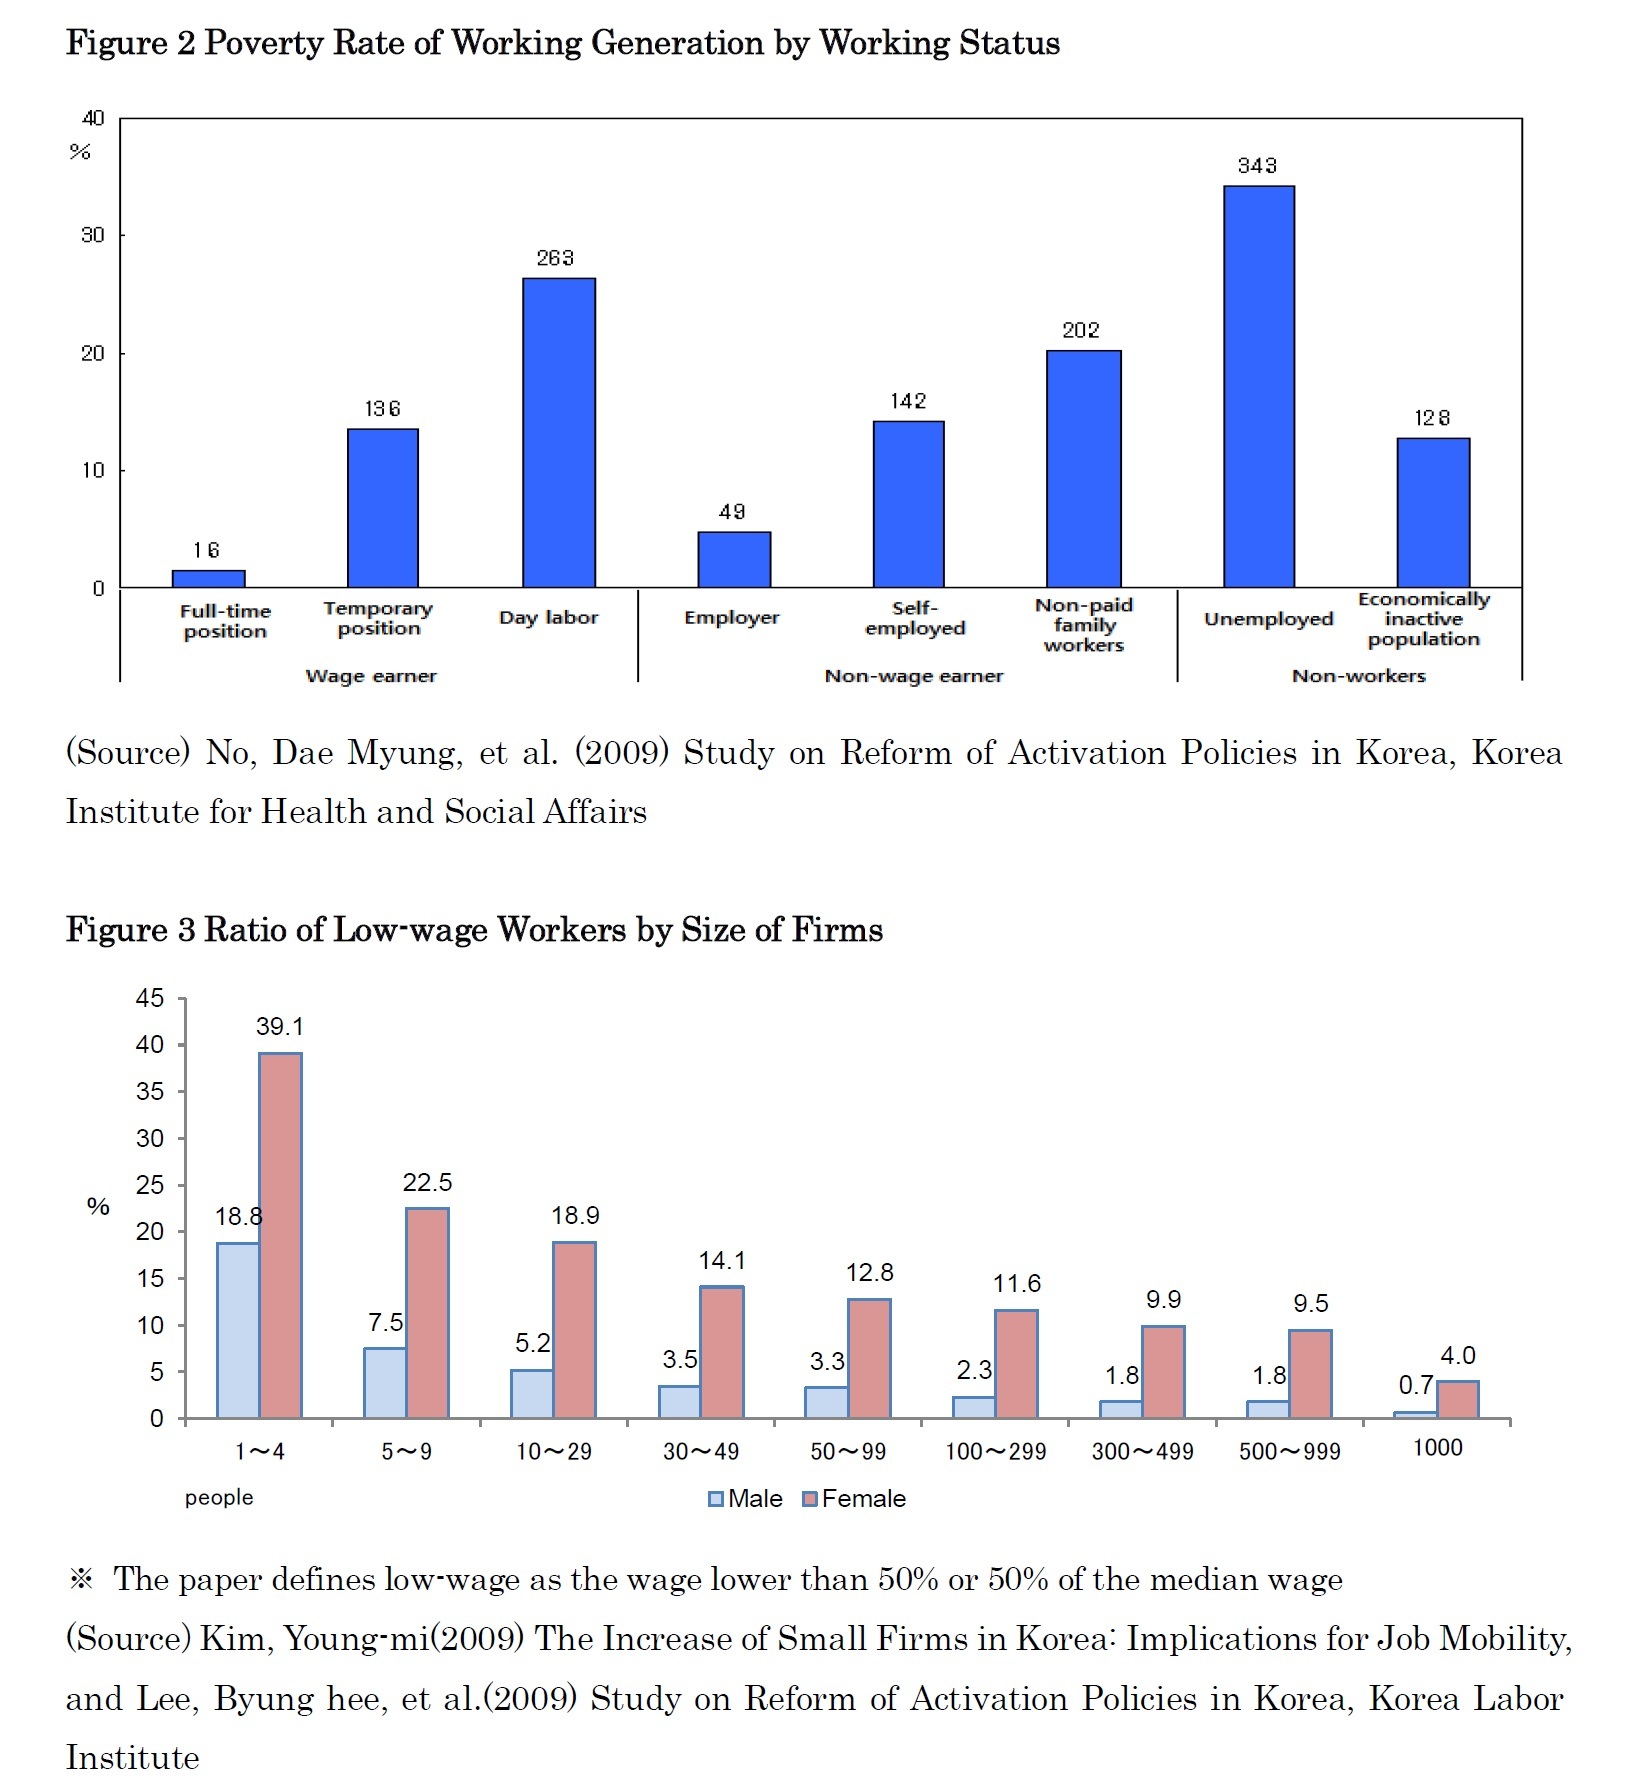
The main reason of poverty among economically active households in South Korea is precarious work. Dae-myung Noh (2009) estimates that about one-third of the unemployed and about a quarter of day laborers are in the poor class (Figure 2).
Young-mi Kim (2009) presents that as the size of an enterprise gets smaller, the years of employment become shorter and the ratio of low income workers gets higher. To be specific, 18.8% of male and 39.1% of female workers in companies of 1~4 workers are low wage employees
4 while 0.7% of male and 4.0% of female workers receive low wage in companies with more than 1000 employees (Figure 3).